
An unusually early spring heatwave is developing across the southwestern United States (US), with temperatures that are more typical of summer than mid-March (AccuWeather, 16 March 2026). Driven by a strong, slow-moving high pressure system, called a ‘heat dome’, the event is causing temperatures to rise 11-17℃ (20-30℉) above average across parts of California, Nevada and Arizona (BBC, 17 March 2026). In many areas, temperatures are expected to exceed 37.8℃ (100℉). In Phoenix, temperature forecasts show multiple consecutive days of around 41.1℃ (106℉), a huge increase over the previous all-time March record of 100℉.
The heatwave poses a significant public health threat, particularly given its timing early in the season. The persistent heat dome is creating stable atmospheric conditions, suppressing cloud formation and precipitation, while allowing temperatures to climb, thus expected to cause persistent heat. Extreme heat is the leading cause of weather-related fatalities in the US. Limited overnight cooling and the lack of air-conditioning is expected to add to the heat stress, particularly for vulnerable populations in these parts who are not acclimatised to the heat, including tourists from cooler countries (CNN, 17 March 2026). This heat dome is breaking records for this time of the year, and is in some ways comparable to the persistent system that caused the 2021 Pacific Northwest (PNW) Heatwave. The PNW event occurred later in the year, in June, with temperatures of up to 48.9℃ (120℉) causing hundreds of fatalities (BBC, 17 March 2026).
The impacts of this early-season heatwave are likely to extend beyond health and have environmental implications. High temperatures are expected to accelerate snowmelt in these parts, including the mountains of Colorado where the snowpack levels are already lowest since 1981 due to the preceding warm winter, and the Sierra Nevada region in California, where although snowfall was average, the high heat is likely to drive rapid snowmelt. Early snowmelt in these parts can reduce water availability during the summer months, increasing the risk of water shortages, prolonging and intensifying dry seasons and increasing wildfire danger (Gergel et al., 2017; Uzun et al., 2021)
Key Messages
- Heatwaves are the deadliest type of extreme weather, with hundreds of thousands of people dying from heat-related causes each year. Extreme heat is most deadly earlier in the year, when people have not acclimated to the heat, and vulnerable people are exposed to high temperatures for the first time.
- Heatwaves as observed in March 2026 in Western North America are still rare events, even in today’s climate which has warmed by 1.3°C due to the burning of fossil fuels, with a return period of about 500 years. As this assessment partly includes forecast data, to prevent an overestimation of the extremeness of the event we use a return period of 100 years throughout the analysis.
- Observation-based data products show a strong increase in the likelihood and intensity of heat waves in the region, suggesting that such events have become about 4°C warmer as a best estimate, and that events as warm as in March 2026 would have been virtually impossible without human-induced climate change. Climate models strongly underestimate this observed trend but still show a significant increase in extreme heat. We combine models and observations, giving equal weight to both lines of evidence, and find an estimated increase in intensity of 2.6°C for such events, with an increase in likelihood of a factor of about 800. This means that without climate change it would have been virtually impossible for the event to occur.
- We also combine climate models and observation-based products in the same way to study changes in only the past 10 years, during which time the world has warmed by approximately 0.4°C. In this short time, we find an increase in intensity of such heat events by 0.8°C and an increase in likelihood of a factor of about 4.
- We also investigated changes in heat extremes at other times of year and across the region. We find that while increases are evident across all months, the most substantial warming signal for heat extremes in this region occurs in March. In this month, temperatures in the current climate are as much as 6°C higher in parts of the region than those observed under a baseline climate approximately 1.3°C cooler. An abundance of weather stations with long records across the region also show a majority of strongly increasing trends with warming, which provides an additional line of evidence to the findings from this analysis.
Heat action plans that reduce heat-related deaths are increasingly being implemented across the region, which is encouraging. However, there remains an urgent need for an accelerated roll-out of heat action plans in light of increasing vulnerability driven by the intersecting trends of climate change and population ageing, paying also special attention to the mental health impacts of extreme heat (Stewart-Ruano et al., 2025). Cities are hot-spots for heat risk, so urban planning needs to focus on measures to reduce the urban heat island effect, such as increasing cooling green and blue spaces.
Overview of heatwaves in North America
Recent research has highlighted the growing intensity and impacts of heatwaves in North America, including the US. At a broader regional scale, warming trends at continental scales show similar tendencies. Gutiérrez et al, 2021 reported warming rates between 0.2°C and 0.3°C per decade across the Central America region, with higher rates of up to 0.5°C per decade in Mexico and southern Baja California in the last 30 years. Additionally, extreme heat episodes have noticeably increased in frequency across most regions of the continent (Seneviratne et al, 2021). Under continued global warming, hot extremes will become more frequent, more intense and longer-lasting (IPCC, 2021).
In an attribution study over the wider region over Mexico and the US, and looking not only at greenhouse gases but also aerosol forcings and internal variability, Gracia-Martinez and Bollasina (2021) found that in addition to anthropogenic greenhouse gases increasing the likelihood of heatwaves, aerosol-induced cooling, in particular between 1950 and 1980, masked these trends, even causing small cooling trends in some locations. This region stands out as a global hotspot, both in observations and projections, with stronger trends in absolute summer maximum temperatures in northern Mexico and the southern U.S. and stronger trends in nighttime temperatures in southern Mexico and Central America (Suarez-Gutierrez et al. 2020).
A prominent example of recent extreme heat is the 2021 PNW heatwave, which provides important context for understanding extreme heat and its drivers in the US. Fleishman et al., 2025 analysed over 70 papers covering the heat wave that occurred across the Pacific Northwest of the United States and Canada in late June 2021. The paper indicates that anthropogenic climate change has increased the mean daily temperatures, although it remains unclear whether trends in extreme daily maximum temperatures are increasing more rapidly than the trend in extreme daily mean temperature. The likelihood of such an event has increased substantially as compared to the pre-industrial era, ranging from 700% to ∞. Furthermore, the likelihood of similar summer heatwaves is expected to increase significantly under continued warming. Supporting this, Chen et al., 2023 found that day-time maximum temperatures in major cities in the Western United States were 10 to 20°C higher than the 10-year average maxima. Zhang et al., 2023 found that the heat dome associated with the PNW heatwave of 2021 accounted for approximately half of the observed temperature anomalies, and that extreme temperatures associated with such heat domes are increasing faster than the background global rise in temperature.
As a consequence of climate change, there is also a growing body of evidence demonstrating that impacts of heatwaves on human health are also increasing. Narayanan and Keellings 2025 found that in the Southwest and Southeast regions of the US, heat-related mortality is increasing at a higher rate than heat severity. In the Southwest and West, the unevenness of population distribution helps to explain the correlation between extent of the event size and mortality outcomes.
Analysis of trends in extremes
Event definition
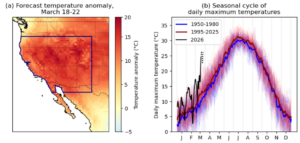
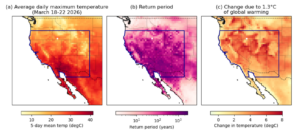
At the time of writing, which occurs while the high temperatures are still ongoing, only one observation-based dataset (ERA5) includes the event, and this is partially based on forecast data. We therefore first use this dataset to find an appropriate study region and event definition. The forecast anomalies are extremely high over much of the western US and northern Mexico (Fig. 1). In order to capture the northern extent of the heat dome we use a northern edge at 45°N, which coincides with the southernmost boundary of the region used to study the Pacific northwest heat dome in 2021 (Philip et al., 2021). We select an eastern boundary based on the presence of the Rocky mountains at approximately 105°W in order to ensure a region of reasonably consistent climatology. Finally, the southern extent was determined by the approximate edge of elevated temperature anomalies at 30°N (Fig. 1a) and the western boundary is determined by the coastline.
Given the strong seasonal cycle of temperatures in this region, we test for changes in heat extremes in March only (Fig. 1b). Additional analysis of changes in extreme heat indices for different periods and over the subregional scale within the study region is highlighted at the end of the ‘Results’ section. Finally, given that the heat is ongoing it is challenging to select an appropriate temporal extent for the event. However, at the time of writing the forecast has remained stable in predicting an intense 5-day period of heat over the study region from March 18th-22nd. We therefore use a 5-day mean of daily maximum temperature, henceforth Tx5x, for this analysis. We note that this event is forecast to continue for a longer period, and is likely to become even rarer by longer metrics. The event definition can be summarised as follows: March maximum of 5-day mean daily maximum temperatures within the region of contiguous North America bounded by 30-45°N and 105°W. (Fig. 1)
The methods used to analyse heat trends follow the standard WWA protocol using non-stationary extreme value theory, as described in Philip et al. 2020 and expanded upon in Otto et al., 2024. Specifically, the extremes index Tx5x is modelled using a generalised extreme value (GEV) distribution that is assumed to shift with global mean surface temperature. A more detailed description of this method and an example can be found in Clarke et al., 2026. In this study we combine observation-based gridded products and climate models (described in the Appendix). In line with the protocol described in Philip et al. 2020, climate models are evaluated in their representation of observed weather and climate characteristics of the region.
Results
Trends in observation-based data
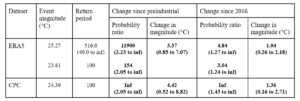
The only observation-based dataset that includes the event (albeit through forecast data) is used to determine the return period of the event. We find that in the present climate, such an event is expected only once every 500 years (Table 1). Given the unprecedented magnitude of the forecasted event, it is extremely challenging to estimate an accurate return period using extreme value theory. We therefore use the benchmark return period of 1 in 100 years for the remainder of this study, with the additional consideration that the forecast may overestimate the final magnitude of the event. We note that this choice of return period affects the estimated probability ratio of the event as a result of warming (Table 1), but only quantitatively, and further that the estimated change in intensity is independent of the event magnitude.
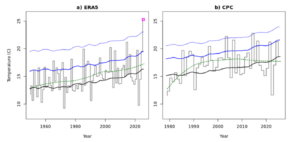
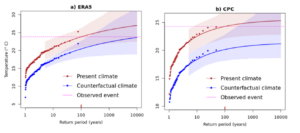
The observation-based datasets both show substantial increases in the likelihood and intensity of heat extremes in the study region in March (Table 1; Figs. 2&3). In the longer dataset, ERA5, the fitted trend with warming accurately matches the loess smoothed trend, while for the shorter dataset a cool period around 1980 (in terms of March heat extremes) results in a worse fit between the GEV model and the time series (Fig. 2). Despite this, the return curves for both datasets display good fits to the data for all except the event itself, which is expected given its unprecedented magnitude (Fig. 3)
All estimated increases are substantial (Fig. 3) and statistically significant at the 5% confidence level (Table 1). These results suggest that 1.3°C of global warming has made such events hundreds of times more likely, suggesting that it would have been virtually impossible without human-induced climate change. Qualitatively, these changes are commensurate with our physical expectations in a warming atmosphere. However, the rate of change is approximately triple the rate of average global warming, with estimated changes in intensity of 3.4°C to 4.4°C for a global warming of 1.3°C. While land is warming faster than the global average, this change is also far in excess of the average land warming rate, suggesting an amplification of heat extremes in the region at this time of year due to a combination of dynamical and thermodynamical factors in tandem.
The rate of increase in heat extremes is also clear over the past decade. The datasets agree that such extremes have become much more likely, but disagree on the rate of this increase, with the shorter dataset (CPC) suggesting that such events were even virtually impossible only 10 years ago (likely due in part to the cooler period around 1980), and the longer dataset (ERA5) showing that such events have roughly tripled in likelihood. Both datasets robustly agree on the rate of intensity change, finding that such heat events have warmed by 1°C to 1.4°C in just 10 years.
Hazard Synthesis
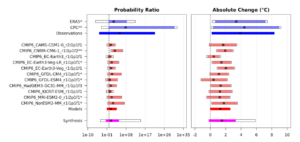
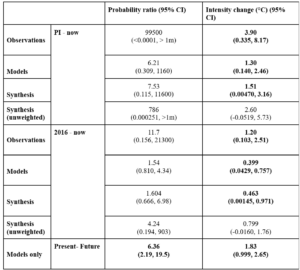
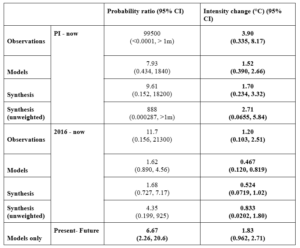
The synthesised results show clearly that 5-day heat events in the study region in western North America are increasing significantly in both likelihood and intensity with global warming. Observational and reanalysis datasets estimate that the likelihood of such an event has increased by a factor of approximately 100000 with a large uncertainty range, or equivalently that the intensity of a 1-in-100-year event has increased by 3.9°C (0.3 to 8.2°C). The model synthesis gives much lower estimates, with the likelihood of such an event increased by a factor of approximately 6.2 (0.3 to 1200), or equivalently that the intensity of a 1-in-100-year event has increased by 1.3°C (0.1 to 2.5°C). This is likely a severe underestimate given the strong observed trends, a characteristic of climate models that is common for extreme heat in regions around the world (e.g. Australia: Clarke et al., 2026; Europe: Zachariah et al., 2022; Central Asia: Clarke et al., 2025).
Synthesising the estimates from observations and models, we find that this event has increased in likelihood by a factor of approximately 7.5 (0.12 to 12000), or equivalently that the intensity of a 1-in-100-year event has increased by 1.5°C (0.005 to 3.2°C). However, given the strong observed increase and the known underestimation of heat extremes by models across multiple studies and regions, we are confident that the true change is likely much larger. In order to reflect this understanding, we also calculate the unweighted synthesis of observation-based and model-based lines of evidence. This unweighted synthesis suggests that event has increased in likelihood by a factor of approximately 800 (0.0003 to >106), or equivalently that the intensity of a 1-in-100-year event has increased by 2.6°C (-0.05 to 5.7°C). This in turn suggests that such record-breaking events were virtually impossible without human-induced climate change.
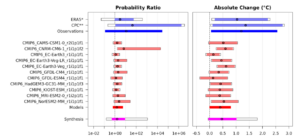
It is also clear that such events are becoming more likely and intense on very short, lived timescales as the world warms. Since 2016, when the world was approximately 0.4°C cooler than present day, observations suggest that similar events to this have become around 12 (0.16 to 21000) times more likely, and equivalently that the intensity of a 1-in-100-year event has increased by 1.2°C (0.1 to 2.5°C). This is again around triple the average global warming rate. The climate models show weaker increases, resulting in the synthesis result that such events have become more likely by a factor of approximately 1.6 (0.7 to 7), and equivalently that the intensity of a 1-in-100-year event has increased by 0.5°C (0.001 to 1.0°C). Even this very conservative estimate represents a change in extremes beyond the global warming rate and a change in likelihood happening within even recent memory, but it is clear that the true values are much larger. In this case, the unweighted synthesis suggests that event has increased in likelihood by a factor of approximately 4.2 (0.2 to 900), or equivalently that the intensity of a 1-in-100-year event has increased by 0.8°C (-0.02 to 1.8°C).
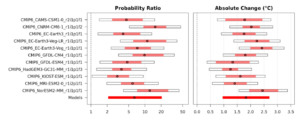
Finally, with an additional 1.3°C of warming from present, present-day 1-in-100-year events will be an additional 6.4 (2.2 to 20) times more likely, and equivalently 1.8°C (1.0 to 2.7°C) hotter. Again, this finding is based on highly conservative climate models. If they underestimate future changes to the same degree as present day, the true change in intensity may be closer to 4°C.
Changes across the region
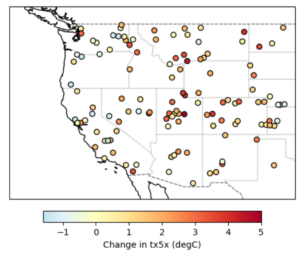
The five day heat from 18-22nd March is extreme across the region (Fig. 1) and with maximum daily temperatures exceeding 30°C for most of the southern half of the study region. The event was also near uniformly rare, with return periods for the 5-day heat near 1000 years for most of southwestern North America. The few exceptions to this rarity of the heat include the central Californian valley, and some northern areas of Nevada and Utah. High elevation regions such as the Sierra Nevada and northwestern forested mountains show the smallest increase in intensity in response to climate change, whilst many locations show an increase of over 6°C in the intensity of a similarly rare event due to human-caused climate change (Fig. 7).
Due to the widespread availability of weather stations in the study region, higher confidence can be taken in the attribution result. This is first due to the better performance of most reanalysis products in areas with more extensive observational records, where products can be assessed and improved to a greater degree of accuracy than, for example, products over less developed countries. Secondly, the trend in observed 5-day maximum temperatures can also be assessed at each station, with the majority of observed trends showing a strong increasing effect of climate change on extreme March heatwaves. It should be noted that as this relies entirely on updates to observed data, unlike the reanalysis products which can be merged with forecast data from the same model, the attribution of these stations does not yet account for the full extent of the March, 2026 record-breaking heat in its assessment of the response of observed temperatures to climate change – which would result in a marginal increase in the estimated effect (Fig. 8).
In addition, it should be noted that since these data are not homogenized to account for changes in reporting practices, for instance (Menne et al., 2012), the individual station trends are not used as part of the attribution analysis and are expected to diverge from the grid-based trends in ERA5. Instead, these trends are shown to visually indicate the direction of change of the majority of trends across the region, which are consistent with other results.
Changes in heat events by season
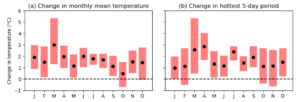
In the attribution analysis we exclusively focus on the effect of climate change on March extreme temperatures, as opposed to seasonal or annual indices. This decision was taken due to the unprecedented early occurrence of such widespread high temperatures (Figure 1). Figure 9 shows the estimated increase in monthly mean and 5-day maximum temperatures in each calendar month, derived using the same statistical modelling approach as in the attribution analysis, along with 95% confidence intervals obtained from 1000 bootstrap samples. While temperatures in the region are warming across all months, the highest change in monthly mean temperatures occurs in March (panel a), and the most rapid warming in 5-day maximum temperatures in March and April (panel b). This is common among shoulder seasons, and of particular concern because high temperatures in early spring tend to be particularly impactful. Health impacts are often more severe during early-season heatwaves because people are not yet acclimated to the higher temperatures; and there may be ecological, environmental and hydrological impacts due to the timing of the event, such as early spring snowmelt, or dehydration of vegetation during a critical growing phase.
Vulnerability and Exposure
Heat risk emerges from the interaction between the intensity and duration of hazardous temperatures, the degree to which populations are exposed to those conditions, their underlying vulnerabilities, and their capacity to cope and adapt. In Southwestern US, these components interact in ways that produce high differential heat risk.
Exposure is elevated by both regional climate and urban patterns, with temperatures unevenly distributed within cities. A study of 20 southwestern US cities found that lower income tend to be several degrees hotter than wealthier areas (Dialesandro et al., 2021). This is predominantly due to higher concentrations of asphalt, limited tree cover, and lower-quality housing that retains heat (Dialesandro et al., 2021). Analyses across California and Nevada show that socially vulnerable neighbourhoods frequently coincide with areas of high surface temperatures and poor building-level cooling, while vegetated areas reduce local heat exposure (Xu et al., 2025; Macharia & Kiage, 2025). Importantly, heat risk often extends beyond urban cores into surrounding suburbs where similar patterns of social vulnerability and land-use amplify exposure.
People experiencing homelessness are amongst the most exposed and vulnerable to extreme heat, particularly in hot-climate counties such as Clark County (Las Vegas) and Los Angeles (Lin et al., 2024). In Maricopa county, 10-25% of heat deaths are people experiencing homelessness (Wang et al 2021, Iverson et al 2020). Their continuous outdoor exposure and limited access to cooling result in mortality rates attributable to heat around 10-100 times higher than those of the general population, with temperatures contributing to roughly 50% of all deaths in Clark County and about 7% in Los Angeles County, the majority of which are driven by heat rather than cold (Lin et al., 2024). Other vulnerable groups include individuals with chronic illnesses, socially isolated populations, and those with limited access to information or resources, as well as older adults, children, outdoor workers, and people with disabilities who are consistently identified as high-risk in extreme heat events (Kelley et al., 2025). Indoor heat risks, especially for those without adequate cooling solutions, can also increase the risk of adverse health outcomes (Edwards et al. 2025). Early-season heatwaves further exacerbate risk for populations who are not yet acclimatized, including migrants, tourists, and returning seasonal residents.
Beyond contributing significantly to excess mortality, morbidity impacts are also widespread, including exacerbations of cardiovascular and respiratory diseases, dehydration-related kidney injury, and deteriorations in mental health and substance-use conditions (Schwarz et al., 2020; Iverson et al., 2020). Acute conditions such as heat exhaustion and heatstroke can also rapidly become life-threatening. Notably, health practitioners report that these health effects begin to occur even below official National Weather Service heat warning thresholds, suggesting that current operational definitions of “extreme heat” do not fully capture risk across all population segments, and that moderate heat events also contribute to increased hospital admissions and emergency department visits (Kelley et al., 2025).
Coping capacity varies throughout the region. At the individual level, the ability to manage heat exposure depends heavily on access to air conditioning, shade, and reliable information, all of which are unevenly distributed. Residents of subsidized housing are disproportionately located in the hottest, most socially vulnerable neighborhoods, where barriers to adaptation are highest (Gabbe & Pierce, 2020). Across 27 California cities, residential air conditioning reduces, but does not fully eliminate, the risks of heat-related illness, and its protective effect is modified by social vulnerability (Romitti et al., 2025). At the community level, housing conditions, neighborhood heat characteristics, and social networks play critical roles, with community-based organizations often filling gaps in outreach and support despite limited resources. At the system level, local health and emergency management agencies increasingly recognize heat as a major hazard, but face constraints related to funding, staffing, and cross-sector coordination (Kelley et al., 2025).
Cities in the Southwest have increasingly formalized heat preparedness through dedicated plans. Phoenix’s 2026 Heat Response Plan organizes 23 actions across six strategies, including providing cooling centers, supporting safe homes, protecting outdoor workers, and conducting community education (City of Phoenix, 2026). The plan explicitly prioritizes services for socially vulnerable populations such as unhoused residents, low-income households, and seniors. The state of Arizona has also appointed a Chief Heat Officer to lead action against extreme heat including the Extreme Heat Preparedness Plan (AZPBS, 2024). Los Angeles County’s (2026) Heat Action Plan focuses on reducing heat exposure in high-risk neighborhoods through shade expansion, renter protections, and energy access programs. It also emphasizes outreach and coordination to ensure vulnerable families, outdoor workers, and schools have timely information and access to cooling resources. Evidence from Maricopa County, Arizona, suggests that access to publicly available air-conditioned spaces can substantially reduce heat-related mortality, particularly in socially vulnerable neighborhoods, whereas the thermal characteristics of individual homes were not significantly protective (Eisenman et al., 2016). Regional and national collaborations, such as the Center for Heat Resilient Communities led by UCLA, Arizona State University, and University of Arizona, also support local planning, tool development, and capacity building. In 2024 and 2025, Maricopa County reported a decline in heat deaths from previous years. (Maricopa County 2025).
The mid-March 2026 heatwave, characterized by temperatures exceeding 106F (41C) in places like Phoenix, illustrates how risk can emerge outside the traditional summer period. Early season heatwaves pose heightened danger because populations are not yet acclimatized, seasonal response measures (such as cooling centers) may not be fully operational, and institutional readiness may be lower.
Corrigendum: Two minor corrections were issued to this article on 16/04/2026:
- The model EC-Earth was removed from the analysis due to data issues. In the original analysis, this model showed a smaller trend than most other models. The adjusted final synthesis results therefore suggest a slightly larger change due to anthropogenic warming than the original figures and do not alter any of our conclusions. The corrected figures are shown in table 3.
- A clarification around the use and interpretation of GHCN-D data has been added to the caption of Figure 8 and the preceding text.
Appendix
Corrected Synthesis:
Data:
The datasets used in this study are as follows:
- ERA5 – The European Centre for Medium-Range Weather Forecasts’s 5th generation reanalysis product, ERA5, is a gridded dataset that combines historical observations into global estimates using advanced modelling and data assimilation systems (Hersbach et al., 2020). We use daily maximum temperature data from this product at a resolution of 0.25°×0.25°, from the years 1950 to 23rd March 2026 (extended with forecast data from March 18th).
- CPC – We use the daily maximum and daily minimum temperatures from the gridded product from NOAA PSL, Boulder, Colorado, USA known as the CPC Global Unified Daily Gridded data, available at 0.5° x 0.5° resolution, for the period 1979 – 24th March 2025. Data are available from NOAA.
- As a measure of anthropogenic climate change we use the (low-pass filtered) global mean surface temperature (GMST), where GMST is taken from the National Aeronautics and Space Administration (NASA) Goddard Institute for Space Science (GISS) surface temperature analysis (GISTEMP, Hansen et al., 2010 and Lenssen et al. 2019).
- CMIP6 – This consists of simulations from 111 realisations of 31 participating models with varying resolutions. For more details on CMIP6, see Eyring et al., (2016). For all simulations, the period 1850 to 2015 is based on historical simulations, while the SSP5-8.5 scenario is used for the remainder of the 21st century.
Authors
Ben Clarke, Centre for Environmental Policy, Imperial College, London, UK
Theodore Keeping, Centre for Environmental Policy, Imperial College, London, UK
Mariam Zachariah, Centre for Environmental Policy, Imperial College, London, UK
Clair Barnes, Centre for Environmental Policy, Imperial College, London, UK
Spandita Mitra, Indian Institute of Technology, Roorkee,Uttarakhand, India and Centre for Environmental Policy, Imperial College, London, UK
Maja Vahlberg, Red Cross Red Crescent Climate Centre, The Hague, the Netherlands; Swedish Red Cross, Stockholm, Sweden
Friederike Otto, Centre for Environmental Policy, Imperial College, London, UK
Review authors
Izidine Pinto, Royal Netherlands Meteorological Institute (KNMI), De Bilt, The Netherlands
Claire Bergin, ICARUS Climate Research Centre, Maynooth University, Ireland
Sjoukje Philip, Royal Netherlands Meteorological Institute (KNMI), De Bilt, The Netherlands
Julie Arrighi, Red Cross Red Crescent Climate Centre, The Hague, the Netherlands


