
World Weather Attribution studies involve several steps to determine whether, and to what extent, an extreme weather event has been influenced by climate change.
The method has been developed over time, peer-reviewed in dedicated methods publications, and applied in more than 100 rapid studies, with 26 of these additionally published in peer-reviewed journals.
The steps are common to all types of attribution studies – not only those carried out by World Weather Attribution.
The first is selecting which extreme weather event to study. The team uses a set of criteria to identify the most impactful weather events around the world. These include how many people are affected, how much damage has been caused and the declaration of a state of emergency or disaster.
After selecting an event to study, the researchers determine the geographical boundaries of the most impacted area, the duration of the event and the best variable to quantify the weather event, such as maximum temperature or average rainfall. This event definition forms the basis of the study.
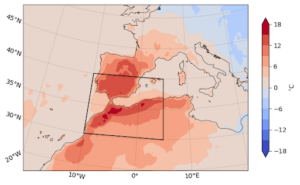
For example, a World Weather Attribution study of a heatwave in the Mediterranean focused on the daily maximum temperature averaged over a three-day period from 26-28 April 2023, in a region that included Spain, Portugal, Morocco and Algeria.
By analysing observational data from weather stations and satellites, researchers can determine how often similar events can be expected (the return period) in the current climate and if they have become more intense or more likely in recent decades.
The second part of each study uses climate modelling to isolate the role of climate change.
Researchers analyse a wide range of climate models to compare the likelihood and intensity of the weather event in two ‘worlds’: today’s world with 1.3ºC of warming, and a hypothetical cooler climate without warming caused by the burning of fossil fuels. Researchers then compare the results to quantify how climate change influenced the event.
Finally, the results from the observational datasets and climate models are combined in a final step, known as the ‘synthesis’. This produces an overarching quantitative estimate of the change in intensity and likelihood caused by climate change, along with a 95% confidence interval for the changes. The width of this interval indicates how well the different data sources constrain the best estimate, and can be used to assess the statistical significance of the findings.
Statistical significance is a measure commonly used in science to help show whether a result reflects a real change or if it could have occurred due to chance – especially when no other information about the data is available and there is no physical reason to expect to see any changes. In cases where a result is statistically significant the researchers highlight it to show how strong the detected trend is. However, a lack of statistical significance shouldn’t be interpreted as evidence that climate change did not influence the event, especially when there are physical reasons to expect that it should.
Given the short length of available observational time series, as well as the high variability of many weather phenomena, in many attribution studies there often won’t be enough data to detect a statistically significant trend emerging over variability. Therefore, researchers don’t rely on statistical significance alone to find evidence of climate change, but complement the statistical analysis with other lines of evidence.
These include the level of agreement between observations and models, the analysis of future trends and how consistent the findings are with the physical understanding of atmospheric processes, extreme weather and climate change. A more detailed explanation of the synthesis method and the lines of evidence used can be found here.
Together, they determine how the final attribution statement is reported and reflect how confident the scientists are in the numbers given. In some cases no quantitative statements are possible.
More information can be found in peer-reviewed papers by World Weather Attribution researchers on attribution methods and event analyses.
This video breaks down each step of our recent study on the late April heatwave that impacted Spain, Portugal, Morocco, and Algeria, highlighting how much hotter and more likely climate change made the event.