The 2026 FIFA World Cup will be played from 11 June to 19 July 2026 across three host countries: the United States of America (USA), Canada, and Mexico, with matches spread over 16 cities and the final to be held in New York on the 19th of July.
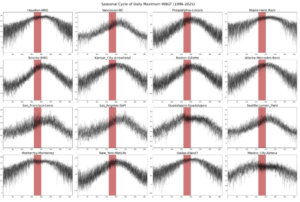
Owing to the tournament’s wide geographic distribution, environmental/climatological conditions are expected to differ substantially between host locations. Matches held in northern or coastal cities, particularly in Canada and along the Pacific coast of the USA, are likely to experience relatively mild temperatures. In contrast, games in more southerly and inland areas of the USA and Mexico will be subject to significantly higher temperatures, frequently approaching or exceeding temperatures of 30°C, with the potential for periods of extreme heat during daytime play. In addition, humidity levels can be high in some regions, particularly along the coasts and in the Midwest, making heat more dangerous. Figure 1 shows the locations of stadiums in which games are planned with average daily maximum temperatures and Wet Bulb Globe Temperatures (WBGT), a measure for humid heat (see below) for the time of year. While World Cups are often played in the northern hemisphere summer, the high variation in the conditions is unique for this event and can make it especially difficult for players to cope (Lindner-Cendrowska et al., 2025).
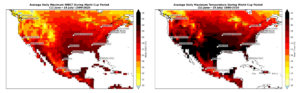
| Wet Bulb Globe Temperature
To measure the combined effect of environmental factors on human heat stress, Wet Bulb Globe Temperature (WBGT) is used as a composite index, combining humidity, radiant heat (such as direct sunlight), and air movement, all of which affect the body’s ability to regulate its internal temperature through sweating and heat exchange. By capturing these interacting variables, WBGT provides a more physiologically relevant assessment of thermal strain, particularly during outdoor physical activity. Consequently, it is widely applied in fields such as sports science and occupational health (Grundstein et al., 2023). Guidance from the global players’ union (FIFPRO) recommends that when Wet Bulb Globe Temperature (WBGT) reaches 26°C or higher, heat strain becomes a real risk and therefore matches must include cooling breaks. At 28°C WBGT and above, conditions are considered unsafe for play and postponement is advised. In this study we approximate WBGT using temperature and humidity (per Zhang et al., 2024) – which means results apply best to a sheltered and shaded area, without the heating effect of direct sunlight or the cooling effect of wind. |
High temperatures combined with high humidity levels are potentially very dangerous for the human body, especially when undertaking strenuous physical activities, such as playing professional association football, not only affecting performance (Schwarz et al., 2025) but also leading to serious illness and heat stroke. In addition to the players, fans may also be adversely affected by elevated WBGTs, particularly those watching matches at numerous public events planned across host cities. The last tournament held in the USA, the 1994 FIFA World Cup, did experience episodes of heat, but such conditions were less widespread than those anticipated today, due to the strong increase in extreme heat and heat stress from human-induced climate change (Li et al., 2020). In this study, we perform an attribution analysis to examine how the frequency and intensity of heat stress (measured as WBGT) have changed since the last US World Cup, using the recent recommendations from the players union FIFPRO of what constitutes dangerous conditions.
This report contains two complementary analyses. First, to understand the likelihood of individual games being affected by humid heat exceeding the thresholds discussed above, we complete an observation-only analysis, taking into account game times and locations, defining the overall likelihood that each game is played at or above different WBGT thresholds. This allows us to estimate the likelihood that the thresholds will be exceeded locally at some point while each game is being played. Second, to attribute the changes in WBGT to human-caused climate change, we carry out a full attribution study following the World Weather Attribution protocol (Philip et al., 2020). This analysis considers trends in maxima of daily maximum WBGT occurring between 11th June and 19th July each year, and combines results from both observations and climate models to estimate the role of human-caused climate change in increasing the WBGT between 1994 and 2026. This means the observation-only analysis can be regarded as more robust than if completed without assessment of the trend in climate models, which account for known physical processes and provide additional representation of the event beyond a limited weather record.
Key Messages
- Guidance from the global players’ union (FIFPRO) recommends that when Wet Bulb Globe Temperature (WBGT) reaches 26°C or higher, heat strain becomes a real risk and therefore matches must include cooling breaks. At 28°C WBGT and above, FIFPRO says it is unsafe for play and postponement is advised. This contrasts with current governing body regulations for the FIFA World Cup, which only consider postponement at WBGT levels exceeding 32°C, indicating a far higher threshold for intervention under official rules.
- Using a statistical model applied to observations we find that in this year’s World Cup 26 games would be expected to take place in conditions of at least 26°C WBGT, of which 9 are in stadiums without cooling. In 1994 we would have expected 21 games to take place under these conditions, and only 6 without cooling.
- For the 28°C threshold deemed unsafe for play, the impact of recent human-induced climate change is stronger, with 5 games expected to take place under these conditions in 2026, compared to only 3 in 1994 including air-conditioned stadiums. For even more severe conditions of 30°C WBGT, the likelihood is still small, but almost double that of 1994.
- While the heat is most extreme in the late afternoon, even games with later kickoff times face significant risks. For example, the Netherlands v Tunisia match kicking off at 18:00 local time in Kansas City has a 7% chance of exceeding the 28°C threshold that FIFPRO guidelines say should lead to postponement.
- Independently of the time of day and exact date, hot events reaching or exceeding Wet Bulb Globe Temperature (WBGT) thresholds of 26°C, 28°C, and 32°C are substantially more likely during the 2026 FIFA World Cup than they were the last time the tournament was hosted in the United States in 1994. Surpassing the 26°C and 28°C thresholds is extremely likely now in the air conditioned stadiums, but there is also a strong increase in the likelihood of reaching these thresholds in some of the open air stadiums, such as Miami, Kansas or Philadelphia.
- When combining the observation-based analysis with climate models to assess the role of climate change in these humid heat events, we find that models on average simulate very similar trends to the observations. The observed increases in the likelihood of extreme WBGT conditions can thus be confidently attributed to anthropogenic climate change.
- When looking at the frequency and intensity of hot events reaching or exceeding critical WBGT thresholds in a 2C global warming world (0.7C warmer than today) we find that climate models consistently simulate further increases in the likelihood of hazardous heat conditions across many potential host locations. These results indicate that, without substantial adaptation measures such as widespread access to air conditioning and cooling infrastructure, staging football matches during the northern hemisphere summer will become increasingly dangerous for both players and spectators in a warming climate.
- While air-conditioned stadiums may reduce heat exposure within match venues, dangerous conditions will remain for public viewing, outdoor gatherings, celebrations, and other forms of social participation associated with major football tournaments. Ensuring that football can continue to be enjoyed safely during northern hemisphere summers therefore depends not only on adaptation measures, but also on rapid mitigation efforts to transition away from burning fossil fuels.
Methods
To assess physiological heat stress risks across host venues for the 2026 FIFA World Cup, we analyse Wet Bulb Globe Temperature (WBGT), a widely used heat stress indicator that combines the effects of temperature, humidity, solar radiation, and wind to reflect the thermal conditions experienced by the human body during outdoor activity. WBGT is particularly relevant for sporting events, as it provides a more direct measure of physiological discomfort and heat-related health risk than air temperature alone. We examine all selected World Cup host venues across the United States, Mexico, and Canada separately, recognizing that differences in regional climate regimes, humidity, elevation, and urban characteristics strongly influence heat stress conditions and associated impacts on players, workers, and spectators.
Given that the tournament is scheduled to take place during June and July, we analyse the daily WBGT from 11 June–19 July, corresponding to the playing period. We assess changes in the likelihood of exceeding FIFPRO established/recommended physiological discomfort thresholds relevant for outdoor sports and human health, between the climate of 1994 and that of 2026. In particular, we analyse exceedance probabilities for WBGT thresholds of 26°C, above which cooling and hydration interventions are generally recommended in professional sports; 28°C, above which FIFPRO recommends delaying the game (FIFPRO) as it is too dangerous to play, as well as 30°C and 32°C. This event definition enables assessment of both average heat stress conditions and the likelihood of extreme heat episodes capable of disrupting tournament activities and posing extreme health risks to players and fans. FIFA has already announced there will be 3 minute breaks during each half of every game during this world cup, regardless of playing conditions (FIFA).
Results
The Chance of Extreme Heat in Individual Games
The likelihood of extreme WBGT thresholds being crossed depends not only on location and the warming climate, but also on the time of day at which games are played. To test for the potential influence of anthropogenic climate change on hot and humid conditions during the 2026 World Cup Tournament, we evaluate the change in probability of experiencing a heat event of 26°C, 28°C, 30°C or 32°C WBGT during the time of each game at each location in the present climate and in 1994 (0.7°C cooler) – when the US last hosted the World Cup.
This section evaluates the change in likelihood (and a 95% confidence interval on that estimate) for each threshold being exceeded, for each hour of the day for days in the period 11 June – 19 July, at each location – according to WBGT approximated from the 0.1° resolution ERA5-Land reanalysis. For each hour of the day at each location, a nonstationary generalised extreme value distribution that shifts with global mean surface temperature (GMST) was fitted to the time series of maximum WBGT in the World Cup period and used to estimate the likelihood of exceeding each of the critical thresholds, both in today’s climate and in a 0.7°C cooler climate. The highest probability of exceedance for a time overlapping with each game (the two hour timestamps following a half-past the hour kick-off, and three following an on-the-hour kick off) was then taken to represent the chance of each threshold being exceeded during game play. Probabilities for each specific game were then derived from the overall probability of a single exceedance for each corresponding time of day and location within the 39-day world cup period. The effect of increases in temperatures within that period was assessed and found to be negligible in comparison to the variability of event occurrences (see supplementary for more information).
The number of games where WBGT is expected to hit 26°C has increased since 1994, from 21.3 games to 25.6 games. However, when air conditioning is taken into account, a much bigger relative increase is observed, with an increase from 6.1 to 9.3 games in stadiums without air-conditioning are likely affected by extreme heat over 26°C WBGT. Similarly, for the much more severe threshold of 28°C WBGT the expected number of games to be played under these extreme temperatures without air conditioning has increased from 0.4 to 0.7. The stadiums most exposed to this extreme heat are the New York Met Life Stadium, the Philadelphia Lincoln Stadium, the Kansas City Arrowhead Stadium, the Miami Hard Rock Stadium, and to a lesser extent Estadio Monterrey, and the Boston Gillette Stadium (Figure 2).
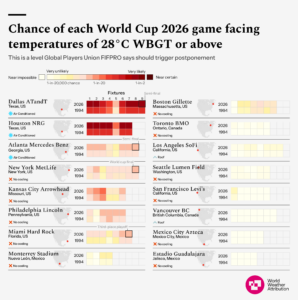
Table 1: The probability of the final eight games of the world cup being affected by 26°C and 28°C WBGT extreme heat according to WBGT data approximated from ERA5-Land. Uncertainty estimates (95% CI) to those probabilities are given in the smaller text below. The first two columns give the likelihood of a game exceeding 26°C WBGT, and the latter two the likelihood of exceeding 28°C WBGT in a 2026 and 1994 climate (with a difference of 0.7°C in global mean surface temperatures). Stadiums with air conditioning are delineated in blue rows, but still included due to the exposure of fans to high temperatures at events surrounding the games. If the probability range includes near certain conditions (~100%), we classify it as “Extremely Likely.”
| Game Details | Chance of 26°C WBGT in 1994 | Chance of 26°C WBGT in 2026 | Chance of 28°C WBGT in 1994 | Chance of 28°C WBGT in 2026 |
| Final: New York
19th July (1500 ET) |
9.5%
7.1% to 16% |
12%
7.3% to 28% |
1.8%
1.3% to 2.4% |
2.7%
1.4% to 4.9% |
| Runner Up: Miami
18th July (1700 ET) |
Extremely Likely 32% to ~100% | Extremely Likely
43% to ~100% |
1.3%
0.89% to 1.9% |
3.1%
1.4% to 6.2% |
| Semi-Final: Atlanta (*AC)
15th July (1500 ET) |
16%
11% to 28% |
17%
10% to 45% |
2.1%
1.6% to 2.8% |
2.6%
1.4% to 4.5% |
| Semi-Final: Dallas (*AC)
14th July (1500 ET) |
Extremely Likely 46% to ~100% | Extremely Likely
~100% to ~100% |
16%
11% to 30% |
29%
17% to 100% |
| Quarter-Final: Kansas
11th July (2100 ET) |
11%
8.4% to 18% |
14%
9.0% to 25% |
2.1%
1.5% to 2.9% |
3.0%
1.4% to 5.6% |
| Quarter-Final: Miami
11th July (1700 ET) |
Extremely Likely 32% to ~100% | Extremely Likely 43% to ~100% | 1.3%
0.89% to 1.9% |
3.1%
1.4% to 6.2% |
| Quarter-Final: Los Angeles
10th July (1500 ET) |
0.62%
0.40% to 0.93% |
1.5%
0.77% to 3.1% |
0.020%
0% to 0.077% |
0.12%
0.013% to 0.39% |
| Quarter-Final: Boston
9th July (1600 ET) |
4.2%
3.3% to 5.5% |
5.0%
3.0% to 8.1% |
0.74%
0.46% to 1.1% |
1.1%
0.41% to 2.3% |
Attributable Change in Dangerous WBGT Conditions
To test for the potential influence of anthropogenic climate change on hot and humid conditions during 2026 World Cup Tournament, we apply the well-established probabilistic event attribution method (Philip et al., 2020) and fit a nonstationary generalized extreme value distribution that shifts with global mean surface temperature to evaluate the relative likelihood and intensity of experiencing 1 day maximum heat events reaching 26°C, 28°C and 32°C WBGT in the present climate, in comparison with a climate of 1994 (0.7°C cooler) when the US hosted last hosted a world cup tournament.
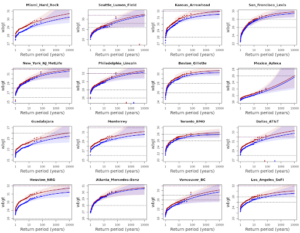
The Chance of Maximum Extreme Heat at each Stadium
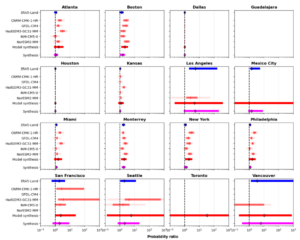
Figure 3 shows the results for each stadium depicting the return period plots (expressed in years) of the events in the current climate (red) versus 1994 climate (blue). Heat events of 26 and 28 WBGT are almost certain to occur in the 2026 world cup in many cities, with Miami, Kansas, Philadelphia, Dallas and Houston having a return period of 1 even for the dangerously hot 28°C WBGT, while for 26°C WBGT, Atlanta, Monterrey, Boston and New York also have a return period of 1 (see Supplementary Table S5). Seattle, Los Angeles, Toronto and San Francisco also have very low return periods for these events in a 2026 climate. In contrast, the extremely dangerous 32°C WBGT remains a very rare event in most places, with only Dallas showing a return period below 100 years. Especially for the more extreme values of 28°C, the likelihood of such events occurring has at least doubled in Los Angeles, Seattle, San Francisco, Monterrey, Toronto and Vancouver since the last US world cup in 1994, due to global warming.
Attribution of Trends
To assess how much of the observed increase at individual locations can be attributed to human-induced climate change, we combine the results from the section above with climate model simulations. We used models from the CMIP6 ensemble with precomputed WBGT. Models were first evaluated to see how well they replicate the seasonal cycle patterns for each stadium, with only models that perform well retained in the full attribution analysis. 5 models were evaluated to perform well and thus utilised for the analysis.
Due to differences in the model climatology, we don’t use absolute WBGT thresholds, but instead estimate the local return period in 2026 of each threshold using the observations, and evaluate changes in the likelihood and intensity of a similarly rare event (eg. one with the same return period) in the climate models; therefore, rather than assessing changes in exceedances of 26°C WBGT, we assess changes in exceedances of the model WBGT corresponding to the return time of 26°C in the observations (see e.g. Kimutai et al., 2025, Clarke et al., 2026). This means that we cannot assess modelled trends at locations where observed return periods are effectively infinite, as such events would be equally impossible in the cooler climate of 1994. Below we provide synthesised results from both observations and climate models for each threshold separately.
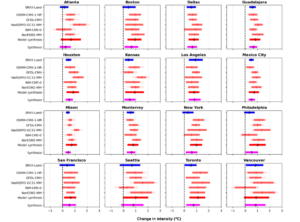
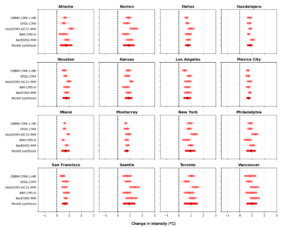
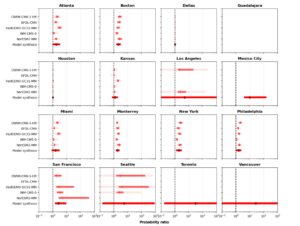
Changes in WBGT intensity
Figure 4 shows the changes in WBGT for observations (blue bars) and models (red bars) between 2026 and the 0.7°C cooler climate of 1994, as well as between 2026 and a future 0.7°C warmer climate (corresponding to 2°C of global warming above pre-industrial levels). Results are synthesised into an overall attribution statement (pink bars) using the algorithm defined in Otto et al. (2024).
Relative to the climate of 1994, the synthesised increase in event intensity ranges from approximately 0.25°C to 0.8°C across most stadiums, with most experiencing WBGT around 0.6-0.7°C higher now than in 1994. The largest increases are in Seattle and Vancouver; Atlanta has experienced the smallest attributable increase. These findings suggest that conditions associated with moderate physiological heat stress are now substantially more intense than during the previous FIFA World Cup hosted in the United States. Consequently, heat-risk management measures, including cooling and hydration interventions will be necessary during this year’s tournament.
Event intensities are projected to increase further as the world continues to warm, with estimated increases ranging from 0.7°C to 1°C associated with a further 0.7°C of warming relative to 2026 conditions.
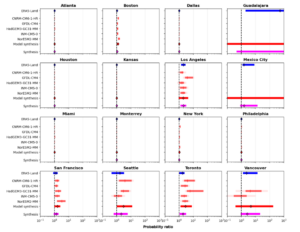
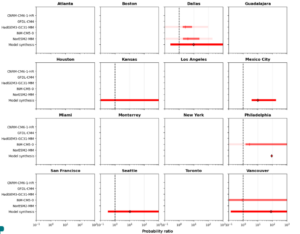
26°C Threshold
Figure 5 shows the corresponding changes in the likelihood of 26°C WBGT events between the climate of 1994 and the 2026 climate, as well as between the 2026 climate and a future 0.7°C warmer climate. The results indicate clear increases in the likelihood of occurrences, attributable to human-induced climate change. A 26°C 1-day maximum WBGT represents conditions associated with notable physiological discomfort during outdoor activity.
Under a future climate of 0.7°C warmer than 2026 (corresponding to 2°C of global warming above pre-industrial levels), the probability of experiencing a 26°C WBGT event remains extremely high across all stadiums. The fact that two venues show PR values close to 1 and four show PR of about 1, does not indicate there is no trend, it rather indicates near-certain occurrence during the tournament period already in today’s climate.
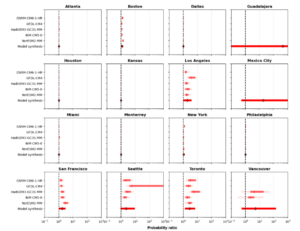
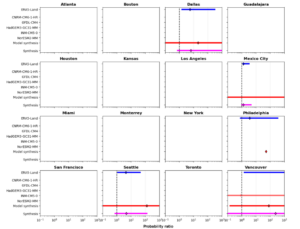
28°C Threshold
Figure 6 shows the changes in the likelihood of 28°C WBGT events between the climate of 1994 and the 2026 climate, as well as between the 2026 climate and a future climate of 0.7°C warmer. These conditions are associated with substantial physiological heat stress, where prolonged activity and high-intensity exercise may pose elevated risks to both health and player performance. Under such conditions, FIFPRO guidelines recommend considering game postponement or delay. Compared with the 26°C threshold, exceedances of 28°C are less spatially widespread, but remain likely across several major host venues.
Changes in the probability ratio between the current climate and that of 1994 show that 28°C WBGT events have become more likely in most analysed stadiums. The fact that Miami, Kansas City, and MetLife Stadium show PR values close to 1, reflects the fact that these events are already highly probable even in the cooler climate of 1994, while Levi’s Stadium in San Francisco shows a doubling in likelihood relative to 1994 conditions. Although some stadiums exhibit relatively modest changes in likelihood, the consistent positive signal across models and observations suggests a clear anthropogenic contribution to increased heat stress risk.
Under a further 0.7°C of global warming, the likelihood of experiencing a 28°C WBGT event increases further at several venues. The strongest projected increases are expected at Lumen Field and Levi’s Stadium, both showing approximately a threefold increase in likelihood relative to 2026 conditions. Miami, Kansas City, and MetLife Stadium continue to show near-certain occurrences.
32°C Threshold
For the 32°C 1-day maximum WBGT threshold, results indicate a substantially higher level of physiological heat stress, with conditions under which cooling and hydration interventions are generally recommended in professional sports and where heat-related health risks become pronounced even without physical activity. Compared with the lower thresholds analysed, 32°C WBGT events remain rare in the current climate across most host venues. Consequently, probability ratio (PR) estimates comparing the 2026 climate with that of 1994 are not robustly assessed, as these events are still extremely unlikely under present-day conditions in many stadiums. However, it is crucial to note that such extreme heat events are still plausible based on recent experience. For instance, in 2021, much of western North America (including the northwestern US and western Canada) experienced a heat dome that broke previous temperature records by almost 5 degrees (Philip et al., 2022; Leach et al., 2024). In March 2026, another such event affected large parts of the western US and northwestern Mexico, setting all-time temperature records across the country (Climate Central, 2026). Both of these events were made substantially hotter and more likely due to human influence on the climate (Philip et al., 2022; Bercos-Hickey et al., 2023; Leach et al., 2024; Clarke et al., 2026). Therefore, even though it is challenging to quantify the likelihood of such events occurring based on the historical record, such record-shattering extremes causing dangerous levels of heat are both plausible and increasingly likely in a rapidly warming world (Fischer et al., 2021).
Finally, as noted above, anthropogenic warming is already intensifying such events, and additional warming towards 2°C global mean temperature rise above preindustrial levels would lead to very large increases in both their likelihood and severity across several World Cup host venues. These changes would substantially elevate risks of heat-related disruption, player safety concerns.
Authors
Joyce Kimutai, Centre for Environmental Policy, Imperial College, London, UK
Theodore R. Keeping, Centre for Environmental Policy, Imperial College, London, UK
Mariam Zachariah, Centre for Environmental Policy, Imperial College, London, UK
Clair Barnes, Centre for Environmental Policy, Imperial College, London, UK
Ben Clarke, Centre for Environmental Policy, Imperial College, London, UK
Friederike E. L. Otto, Centre for Environmental Policy, Imperial College, London, UK
Review Authors
Sjoukje Philip, Royal Netherlands Meteorological Institute (KNMI), De Bilt, The Netherlands
Roop Singh, Red Cross Red Crescent Climate Centre, The Hague, The Netherlands (based in New Jersey, USA)
Supplementary
Full data on WBGT threshold probabilities for every game – download link
Full Synthesised Attribution Results for Maximum WBGT in Period
Table S5: Estimated observed return periods, probability ratio, and event magnitude for annual 1-day maximum WBGT thresholds of 26°C, 28°C, and 32°C across the 2026 World Cup host venues. Values in brackets indicate bootstrapped 95% confidence intervals. The final column shows the estimated changes in WBGT in a climate 0.7°C cooler than 2026 for events with the same return period as in 2026. These values are calculated by subtracting the estimated magnitude change associated with 0.7°C of warming from the 2026 WBGT values.
| Dataset | ERA5-land | ||||||||
| Stadium | Return period (years) | Probability Ratio | Change in magnitude
(units) |
||||||
| 26ºC | 28ºC | 32ºC | 26ºC | 28ºC | 32ºC | 26ºC | 28ºC | 32ºC | |
| Miami, FL | 1.00
(1.00,1.00) |
1.00
(1.00,1.08) |
Inf
(2014,inf) |
1.60
(0.42,3.22) |
1.21
(1.09,1.31) |
NA (1.9,inf) |
1.00
(0.36, |
0.43
(0.26,0.59) |
NA
(0.27,0.67) |
| Seattle, WA | 4.90
(2.8,91.8) |
23.81
(9.5,inf) |
4241.00
(162.00,inf) |
1.64
(0.43,3.22) |
1.96
(1.06,inf) |
4.22
(1.07,44.2) |
0.69
(-0.24,1.36) |
0.69
(0.05,1.43) |
0.69
(0.05,1.4) |
| Kansas City, MO | 1.00
(1,1.003) |
1.01
(1,1.07) |
32166.00
(91,inf) |
1.00
(1,1) |
1.03
(1,1.06) |
Inf
(3.82,inf) |
0.42
(0.11,0.76) |
1.41
(0.11,0.81) |
0.41
(0.19,0.82) |
| San Francisco, CA | 2.11
(1.4,4.30 |
13.87
(4.88,100.23) |
Inf
(13879,inf) |
1.25
(0.82,1.66) |
1.85
(0.56,4.65) |
NA
(0.5,inf) |
0.37
(-0.24,1.00) |
0.37
(-0.23,0.99) |
(-0.34,1.12) |
| New York/NJ
MetLife |
1.006
(1.001,1.05) |
1.46
(1.14,2.21) |
32871
(126,inf) |
1.01
(0.99,1.02) |
1.18
(0.90,1.39) |
457009
(0.25,inf) |
0.29
(-0.15,0.74) |
0.29
(-0.16,0.74) |
0.29
(-0.09,0.77) |
| Philadelphia, PA | 1.001
(1,1.006) |
NA | 449
(53,inf) |
1.00
(0.99,1.04) |
NA | 3.5
(0.74,inf) |
0.33
(-0.08,0.74) |
NA | 0.33
(-0.07,0.79) |
| Boston (Foxborough) | 1.06
(1.0,1.18) |
1.97
(1.32,3.2) |
Inf
(inf,inf) |
1.05
(0.98,1.08) |
1.33
(0.98,1.78) |
NA
(6.07,onf) |
0.4
(-0.07,0.98) |
0.39
(-0.07,0.98) |
NA
(0.5,1.23) |
| Mexico City, MX | 8995.8
(381.25,inf) |
450055
(795,inf) |
577384
(2489,inf) |
1.5
(1.18,8.17) |
1.4
(1.14,5,58) |
1.29
(1.1,3.5) |
0.47
(0.31,0.70) |
0.47
(0.31,0.69) |
0.47
(0.31,0.7) |
| Guadalajara, MX | 7048.31
(172.46,inf) |
Inf
(4713.77,inf) |
Inf
(643068,inf) |
434.17
(1.96,inf) |
NA
(1.52.inf) |
NA
(1.26,inf) |
0.61
(0.33,0.87) |
(0.3,0.85) | NA
(0.27,0.79) |
| Monterrey, MX | 1.0
(1.,1.02) |
1.26
(1.06,1.78) |
Inf
(329,inf) |
1
(1,1) |
1.72
(1.37,2.18) |
NA
(1.5,inf) |
0.59
(0.26,0.87) |
0.59
(0.270.86) |
NA
(0.29,0.85) |
| Toronto, ON | 3
(1.8,6.2) |
129.45
(17.6,inf) |
Inf
(inf,inf) |
1.7
(1.07,2.41) |
250041
(3.63,inf) |
NA
(528,inf) |
0.54
(0.04,1.01) |
0.54
(0.22,1.02) |
NA
(0.65,1.004) |
| Dallas (Arlington), TX | 1.00
(1.00,1.00) |
1.00
(1.00,1.00) |
63
(15,1251) |
1
(1,1) |
1
(1,1) |
5.5
(1.4,inf) |
NA
(0,28,0.92) |
0.56
(0.2,0.91) |
0.56
(0.2,0.94) |
| Houston, TX | 1.00
(1.00,1.00) |
1.00
(1.00,1.00) |
Inf
(652,inf) |
1.00
(1.00,1.00) |
1.00
(1.00,1.00) |
NA
(5.03,inf) |
0.37
(0.24,0.78) |
0.48
(0.25,0.71) |
NA
(0.29,072) |
| Atlanta, GA | 1.00
(1.00,1.00) |
1.42
(1.15,2.00) |
Inf
(3292,inf) |
1.00
(0.99,1.00) |
1.11
(0.83,1.36) |
NA
(1.89,inf) |
0.15
(-0.21,0.48) |
0.15
(-0.21,0.48) |
NA
(0.1,0.58) |
| Vancouver, BC | 16.5
(6,75,inf) |
161.79
(33.61,inf) |
129473393
(1400,inf) |
2.32
(1.29,inf) |
3.46
(1.28,96028) |
2625194
(1.3,inf) |
0.82
(0.23,1.48) |
0.82
(0.24,1.52) |
0.82
(0.2,1.54) |
| Los Angeles, CA | 1.92
(1.3,3.3) |
14.88
(5.17,109.86) |
Inf
(1107,inf) |
2.03
(1.41,2.89) |
5.27
(2.02,90.89) |
NA
(2.21,inf) |
0.89
(0.37,1.49) |
0.89
(0.38,1.49) |
NA
(0.44,1.57) |


