
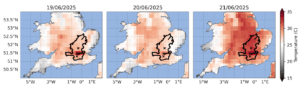
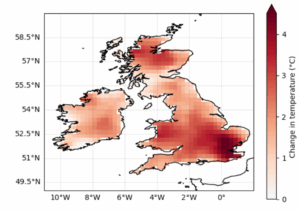
As the week progresses, southerly winds are drawing in warmer air, pushing temperatures in the South of England toward heatwave conditions by the weekend of the 21st and 22nd of June (Met Office, 2025). In the UK, a heatwave is officially declared when a location experiences temperatures at or above a specific threshold for at least three consecutive days. These thresholds vary by region based on the local climate. In cooler areas, such as much of northern and western Britain, the threshold is 25°C. In warmer regions, including Greater London and the surrounding southeastern areas, the threshold is higher at 28°C (see outlined area in figure 1) (Met Office). When the Met Office first introduced its heatwave definitions, the area for which the threshold was 28°C was limited to greater London only (McCarthy et al., 2019). The threshold has subsequently been expanded to include the surrounding counties. This occurred when the Met Office shifted from a 1981-2010 to a 1991-2020 baseline in March 2022, to reflect the increase in temperatures that has occurred as a result of human-induced climate change (Royal Met Soc, 2022).
Heatwaves pose a serious threat to human health and have profound impacts on ecosystems. During the summer of 2022, more than 60,000 people across Europe died as a result of extreme heat. Even in the following summer, which was significantly cooler, over 47,000 heat-related deaths were recorded (Gallo et al., 2024). As this current event marks the first heatwave of the year, warnings must be taken especially seriously. Early-season heatwaves tend to be particularly deadly, as people have not yet acclimatised to high temperatures and are often less prepared.
WWA performed a super rapid analysis, analysing observations only on this early summer heat in the Southeast of the UK, defined (1) by the official heatwave definition of reaching 28°C in many of the so-called home counties and greater London (dark red region in figure 1, Met Office) and (2) the hottest predicted day in the same area. While this is not a full attribution study, the results are in agreement with the study undertaken in July 2022 over a similar region (Zachariah et al., 2022), thus we have high confidence in the results.
The event
A high-pressure system over southern England has expanded to cover much of the UK since the start of the week beginning June 16th, bringing calm, sunny days and gradually rising temperatures. As the week progresses, southerly winds are drawing in warmer air, pushing temperatures in the South of England toward heatwave conditions by the weekend of the 21st and 22nd of June (Met Office, 2025). In the UK, a heatwave is officially declared when a location experiences temperatures at or above a specific threshold for at least three consecutive days. These thresholds vary by region based on the local climate. In cooler areas, such as much of northern and western Britain, the threshold is 25°C. In warmer regions, including Greater London and the surrounding southeastern areas, the threshold is higher at 28°C (see outlined area in figure 1) (Met Office). When the Met Office first introduced its heatwave definitions, the area for which the threshold was 28°C was limited to greater London only (McCarthy et al., 2019). The threshold has subsequently been expanded to include the surrounding counties. This occurred when the Met Office shifted from a 1981-2010 to a 1991-2020 baseline in March 2022, to reflect the increase in temperatures that has occurred as a result of human-induced climate change (Royal Met Soc, 2022).
Heatwaves pose a serious threat to human health and have profound impacts on ecosystems. During the summer of 2022, more than 60,000 people across Europe died as a result of extreme heat. Even in the following summer, which was significantly cooler, over 47,000 heat-related deaths were recorded (Gallo et al., 2024). As this current event marks the first heatwave of the year, warnings must be taken especially seriously. Early-season heatwaves tend to be particularly deadly, as people have not yet acclimatised to high temperatures and are often less prepared.
WWA performed a super rapid analysis, analysing observations only on this early summer heat in the Southeast of the UK, defined (1) by the official heatwave definition of reaching 28°C in many of the so-called home counties and greater London (dark red region in figure 1, Met Office) and (2) the hottest predicted day in the same area. While this is not a full attribution study, the results are in agreement with the study undertaken in July 2022 over a similar region (Zachariah et al., 2022), thus we have high confidence in the results.
Key Messages
- The early summer heatwave triggered an amber heat health alert for all of England, indicating a heightened risk of death for people over the age of 65, increased risk of overheating of indoor environments, a high demand for health services and increased power demand (UK government, 2025). Early season heat tends to be more deadly as people are not yet acclimatized to summer temperatures.
- Heatwaves are the deadliest type of extreme weather globally, with hundreds of thousands of people dying from heat-related causes each year. In the case of this heatwave, the forecast temperatures are largely a risk to the most vulnerable populations such as people over 65, and people with pre-existing conditions such as respiratory and cardiovascular disease. In past years (e.g. 2023) even yellow heat-health alerts have resulted in significant heat-related mortality (UK Government, 2025).
- In the present climate, crossing the heatwave threshold in June in southeast England is expected once every 5 years. In other words, every June there is a 20% of experiencing a heatwave. Before humans warmed the atmosphere, the chances would have been only 2% in any given June, meaning such an event would have occurred about once every 50 years.
- The heatwave as defined was made approximately 2-4oC more intense as a result of climate change of 1.3oC, turning early summer sunny weather into a dangerous heatwave.
- The hottest day in the forecast is approximately 32oC across the region. This is a rarer event, expected in June only once every 25 years. Similar analysis of the changes in likelihood of this finds that such events have become about 100 times as likely, occurring in June only once every 2500 years before industrialisation. This shows that the chance of experiencing the most intense heatwaves is increasing most rapidly.
- The results align with WWA’s 2022 UK heatwave study in terms of the increase in intensity, which showed that the most extreme heatwaves in southern England have also become around 2°C hotter due to human-induced climate change. However, the current event is less intense than the 40°C record-breaking heatwave of 2022 and therefore has a smaller change in probability. The associated impacts this time are also expected to be less severe due to the lower peak temperatures.
- These trends are strongest in southeast England, but heat extremes are increasing across all of the UK and Ireland as the world warms.
- High temperatures can have a secondary effect on wildfire risk. Hotter temperatures result in an increase in evaporative demand, drying out fine leaf litter and grasses. The drier vegetation conditions exacerbates the risk of wildfires, particularly in areas of continuous vegetation such as moorlands.
- High temperatures, in combination with an ageing population, a building stock that is not designed for extreme heat, and the urban heat island effect create the conditions for heat-related mortality and morbidity.
- The heat-health warning system, Heatwave Plan for England, regulations in England that require new homes to consider the risk of overheating, and related efforts indicate progress towards addressing these risks. However, there is room for improvement to address the scale and urgency created by the increasing frequency and intensity of these events due to climate change, including by filling gaps in policies and reducing fragmentation.
Analysis of trends in extremes
In this short observation-only analysis we examine trends in heat extremes like the one occurring in southeast England in June 2025.
Observed extreme heat
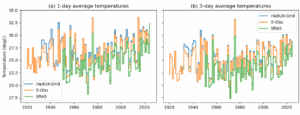
The unusually high temperatures observed in the southeast of England in June 2025 are studied by analysing changes in the highest temperatures for the month of June each year. As the event occurs at the start of the summer season, and temperatures are likely to increase further as a result, the study is focused on the June high temperature data rather than summer data as a whole. In the UK, heatwaves are defined by three or more consecutive days exceeding a specific temperature threshold. The thresholds are set at the county level and vary between 25-28oC depending on the local climatology. The highest threshold, 28oC, covers a contiguous region of southeast England, including the counties Cambridgeshire, Bedfordshire, Buckinghamshire, Hertfordshire, Greater London, Surrey and Berkshire (figure 1). In this study, we analyse the likelihood of crossing the threshold of 28C for three consecutive days averaged across all of these counties. Three observational and reanalysis datasets are used: ERA5, EOBS, and HadUK. The methods used to analyse heat trends follow the standard WWA protocol using non-stationary extreme value theory, as described in Philip et al. 2020.
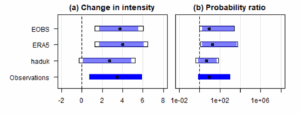
At the time of writing, which occurs while the high temperatures are still ongoing, only one observation-based dataset includes the event, and this is as a forecast. We therefore first use this dataset to estimate the return period of the extreme heat over the study region. The forecast intensity of the heatwave is 28.7oC, which is approximately a 1 in 7 year event. The likelihood of a 28oC event in the present climate is approximately 1 in 5 years (in June). Given that the event is a forecast at the time of analysis (and thus the magnitude is not yet set), and that it is very close to the heatwave threshold over the region, we consider changes in the 1 in 5 year event to correspond as closely as possible to this heatwave definition. Finally, using the two other datasets, we test changes in the probability ratio and magnitude of a 5-year return period event, and combine the results into a final statement. The results of this analysis are shown in table 1.
Table 1: Return period and magnitudes of the 3-day heat event as observed in ERA5, and magnitudes of the 1 in 5 year maximum temperature events in EOBS and HadUK-Grid datasets in 2024 in the region over southeast England shown in figure 1. The probability ratio and change in intensity associated with a 1.3oC increase in global mean surface temperature (GMST) are estimated for each dataset, with bootstrapped uncertainties. Finally, the synthesised results for all datasets are shown in the final row. Statistically significant (at the 95% level) results are highlighted in bold text.
| Dataset | 3-day event | Trend | ||
| Magnitude (oC) | Return period | Probability ratio
(95% C.I.) |
Change in intensity (oC) (95% C.I.) | |
| ERA5 | 28.72 | 7.38
(4.17 – 23.88) |
17.65
(3.32 – inf) |
4.00
(1.95 – 5.79) |
| 28 | 5.05
(2.99 – 12.47) |
– | – | |
| EOBS | 29.31 | 5 | 8.93
(3.40 – 1318) |
3.73
(2.03 – 5.29) |
| HadUK-Grid | 29.23 | 5 | 4.73
(1.31 – 27.45) |
2.70
(0.32 – 4.58) |
| Synthesis | 9.06
(1.44 – 565) |
3.48
(1.01 – 5.68) |
||
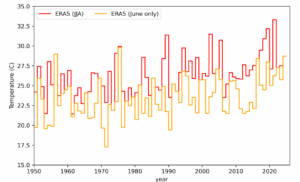
All datasets show strong and statistically significant trends in June heatwaves as the world has warmed. Across the different datasets, the likelihood of crossing the heatwave threshold in June has increased by a factor between approximately 5 and 18. Equivalently, the intensity of the event has increased by between 2.7oC and 4oC. By synthesising these results, we estimate that the probability of a June heatwave in this region has increased by a factor of 9 (1.4 – 560), or similarly the 1 in 5 year June heat event has become 3.5oC (1 – 5.7 oC) hotter as the world has warmed (table 1, fig. 3).
The hottest day in the forecast is expected to reach approximately 32oC across the region. This 1-day event is rarer than the 3-day event described above, expected in June only once every 23 years. Using the same method and considering 1 in 25 year 1-day heat events in June, we find that such events have become about 94 (3.4 – 1000000) times as likely, occurring in June approximately once every 2500 years before industrialisation (table S.1). The change in magnitude of such events is also slightly higher, at 4.1oC (1.5 – 6.6oC). This shows that the chance of experiencing the most intense heatwaves is increasing most rapidly.
To test the sensitivity of these results to the event definition, we compare the trends in June to the trends over the wider summer season, to the results at local scales, and across other recent studies.
First, the results are similar, if slightly stronger, when considering heatwaves over all summer months (June-August, JJA). For instance, 1 in 5 year 3-day heatwaves during JJA have become about 37 (8 – 1900) times more likely, and 4.7oC (2.9 – 6.5oC) more intense. Meanwhile, 1 in 25 year 1-day heatwaves during JJA have become about 85 (4 – 312000) times more likely, and 5.3oC (3.2 – 7.1oC) more intense. The relative time series in ERA5 for June only and JJA are shown in fig. S.1.
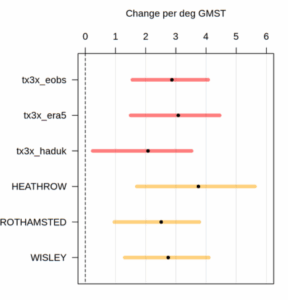
Similar results are also found at the local scale. Figure 4 shows the relative change in 3-day heatwave events per unit of global warming in the three gridded datasets averaged over the region, and three local weather stations around the region. All stations show increases in intensity of 2.5-4oC per oC of warming, slightly exceeding the larger scale average.
Finally, in 2022, when the UK hit 40oC for the first time in any record, World Weather Attribution undertook a similar analysis (Zachariah et al., 2022) using both observations and a range of climate models. This study considered a slightly wider region over most of southern England, and at all summer heatwaves (not only in June). However, the results are consistent with those here, finding that observed temperatures show approximately a 4oC increase with warming, and when combining with climate models settling on a more conservative increase of 2oC. Even this more conservative change in temperatures would cause the June 2025 event to cross the heatwave threshold, changing it from warm sunny weather into dangerous heat.
In summary, temperature extremes in June in southeast England have increased with global warming. This increase in temperature is to the extent where an event classified as a heatwave now would not have been classified as a heatwave should global warming not have been present. The current heatwave event is 2-4oC warmer due to climate change. While a full attribution would require an assessment of trends in climate models as well as observations, the results in Table 1 are in line with past similar studies for the region (Zachariah et al., 2022), and robust across a range of spatial and temporal scales.
Vulnerability and exposure
As conceptualized by the IPCC, climate risk arises from the interplay between hazard, exposure, vulnerability of people, systems, and assets. Research on the effect of ambient heat on mortality in the UK has consistently found an increased risk of all-cause mortality with increasing temperatures above threshold values (Arbuthnott & Hajat, 2017). In particular, extreme heat earlier in the summer is associated with higher heat-related mortality due to a lack of acclimatisation, adaptive behaviors and harvesting effects (Gasparrini et al., 2016) In the UK older age groups are at highest risk of heat-related health impacts and death, underscoring the importance of the UK Health Security Agency’s yellow heath-health alert that was issued on 11 June and focused on the increased use of health care services by vulnerable populations, and increased risk for people over 65 (Arbuthnott & Hajat, 2017, UKHSA, 2025).
National survey data gathered prior to the 2025 heatwave indicated that nearly half of UK residents already experience uncomfortably hot indoor conditions during extreme heat events, but only 15% believed that their health would likely be affected by future heat (Jennings et al., 2025). This perception gap is particularly concerning given consistent evidence that older adults, people with chronic illnesses or disabilities, and low-income groups are disproportionately at risk of serious health consequences during heatwaves (Åström et al., 2025; Bouchama et al., 2017; Kapur et al., 2024). As previous research has shown, vulnerabilities are also shaped by social and environmental factors such as social isolation, housing quality, access to cooling infrastructure, and the strength of local social networks (Klinenberg, 2025; Chakraborty et al., 2019; Schwarz et al., 2021; Colluci et al., 2021). If these high-risk groups do not perceive their own vulnerability, opportunities for early action and adaptation may be missed.
Heat-related mortality in the UK has become an increasingly urgent public health concern. The 2003 European heatwave, which resulted in 2,091 fatalities in England alone (Johnson et al., 2005), acted as a catalyst for the establishment of national early warning systems and the development of the Heatwave Plan for England in 2004, later updated in 2012, to coordinate preparedness and response across the health and social care systems (PIRU, 2019). These plans represent significant progress in recognising the large human health risk associated with heat, and evidence-based interventions to reduce this risk. The 2022 heatwave marked a new record, with temperatures exceeding 40C for the first time and an estimated 2,985 heat-related deaths recorded in England (CCC, 2025). While the 2025 event is not expected to reach such record-breaking temperatures, even relatively short heat events and those with yellow Heat Health Alerts issued are known to be associated with significant heat-related mortality, including in 2023 (UK heat mortality monitoring report: 2023). While there has been progress, recent evaluations show that existing plans and health infrastructure are insufficient to protect vulnerable populations, notably older adults, those with chronic illness, and people in poorly ventilated housing (Brimicombe et al., 2021; Bouchama et al., 2017). Without significant adaptation, heat-related deaths could rise to over 10,000 in an average year by 2050, driven by a combination of climate change and an increasingly vulnerable, ageing population (CCC, 2025).
Existing research and assessments also suggest that the UK’s building stock is designed for heat retention (Kapur et al., 2024). In areas such as London, the Urban Heat Island (UHI) effect significantly exacerbates overheating, particularly in dense inner boroughs with low access to green infrastructure (Ibid.; Goddard & Tett, 2019; Chakraborty et al., 2019). An estimated 90% of homes may require structural measures to avoid dangerous indoor conditions as temperatures continue to rise (Kapur et al., 2024). This is particularly relevant in this heatwave, in which care homes and hospitals where more vulnerable people are concentrated and likely to be exposed to high indoor temperatures.
While official post-event analyses are still pending for this heat event, the Climate Change Committee (CCC) (2025), an independent statutory body tasked with advising UK governments and reporting to Parliament on climate progress, has highlighted gaps in the UK’s overall adaptation trajectory. It notes, in particular, that heat-related policies and plans are fragmented and without long-term targets, and there is a lack of consistent monitoring of how extreme heat affects healthcare delivery or outcomes across the health system (CCC, 2025). While there is significant room for improvement, a post-event evidence report from the 2022 heatwave that gathered experiences from policymakers, emergency responders, utility sector and civil society found that the presence of strong teams, agile decision-making, prioritising vulnerable groups, successful forecasting and early warning systems and the deployment of the national heat alert system were all positive aspects of the UK’s response to that heatwave (Howarth et al., 2024). Overall, there is a strong foundation from which the UK can improve its heatwave adaptation planning to prepare for more dangerous events.
Supplementary information
| Dataset | 1-day event | Trend | ||
| Magnitude (oC) | Return period | Probability ratio
(95% C.I.) |
Change in intensity (oC) (95% C.I.) | |
| ERA5 | 32.31 | 22.75
(9.27 – inf) |
13500
(13.69 – 10^13) |
4.82
(2.66 – 6.87) |
| EOBS | 33.63 | 25 | 91.35
(5.57 – 400000) |
4.07
(2.11 – 6.17) |
| HadUK-Grid | 33.67 | 25 | 45.13
(3.07 – 143000) |
3.31
(1.24 – 5.40) |
| Synthesis | – | 25 | 94.30
(3.39 – 10^6) |
4.07
(1.53 – 6.61) |
Table S.1: Return period and magnitudes of the 1-day event as observed in ERA5, and magnitudes of the 1 in 25 year maximum temperature events in EOBS and HadUK-Grid datasets in 2024 in the region over southeast England shown in figure 1. The probability ratio and change in intensity associated with a 1.3oC increase in global mean surface temperature (GMST) are estimated for each dataset, with bootstrapped uncertainties. Finally, the synthesised results for all datasets are shown in the final row. Statistically significant (at the 95% level) results are highlighted in bold text.
Authors
Ben Clarke, Centre for Environmental Policy, Imperial College, London, UK
Claire Bergin, ICARUS Climate Research Centre, Maynooth University, Ireland
Clair Barnes, Centre for Environmental Policy, Imperial College, London, UK
Maja Vahlberg, Red Cross Red Crescent Climate Centre, The Hague, the Netherlands; Swedish Red Cross, Stockholm, Sweden (based in Ubmeje/Umeå, Sweden)
Roop Singh, Red Cross Red Crescent Climate Centre, The Hague, the Netherlands (based in New Jersey, USA)
Friederike Otto, Centre for Environmental Policy, Imperial College, London, UK
Review authors
Izidine Pinto, Royal Netherlands Meteorological Institute (KNMI), De Bilt, The Netherlands
Laura Scott, British Red Cross, London, UK
Henry Barnes, British Red Cross, London, UK
Julie Arrighi, Red Cross Red Crescent Climate Centre, The Hague, the Netherlands; Global Disaster Preparedness Center, American Red Cross, Washington D.C., USA; University of Twente, Enschede, the Netherlands (based in New York, USA)


