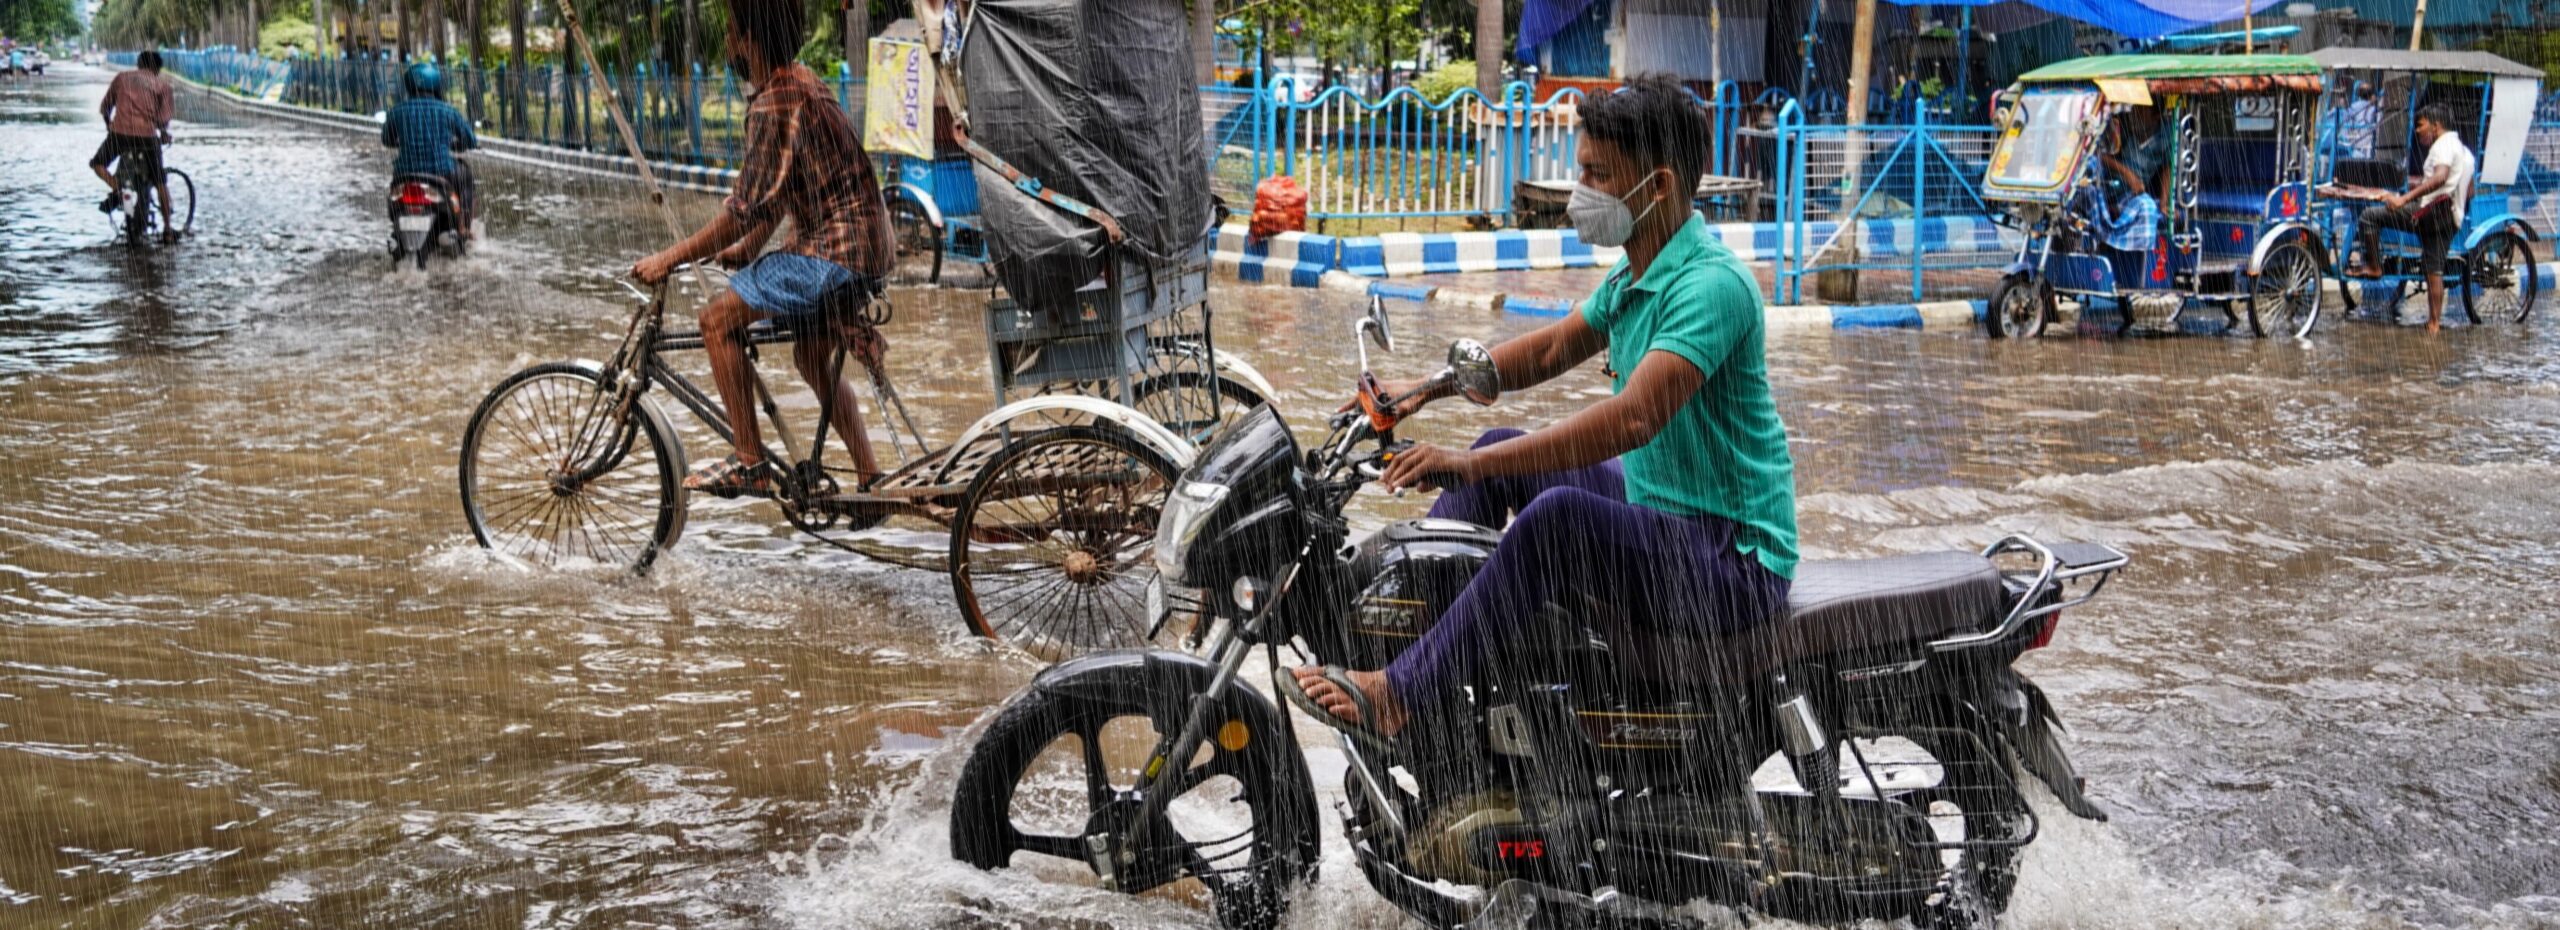
The state capital, Baton Rouge, suffered through nearly a foot of rain on a single day, August 12, and nearly as much the day after. Historic flooding of the state claimed at least 13 lives and damaged more than 60,000 homes. Rescue teams saved 30,000 people from the floodwaters and relocated displaced residents to drier grounds. Among the evacuees were Louisiana governor John Bel Edwards and his family, who sought shelter when rainwater flooded the governor’s mansion in Baton Rouge. The federal government declared a dozen parishes major disaster areas. The Red Cross deemed the flooding in Louisiana the worst natural disaster in the United States since Superstorm Sandy slammed into the U.S. East Coast in 2012.
Event
On August 12, NOAA’s Weather Prediction Center described the heavy rain event as “an inland sheared tropical depression.” The event bore some of the same characteristics of a tropical depression: very slow-moving low pressure system combined with extreme tropical moisture. The subsequent historic rains and floods that paralyzed Louisiana and other parts of the Gulf Coast resulted largely from a combination of these two conditions.
Scattered thunderstorms began popping up in parts of Louisiana on August 9 with the storm system forming to the east, off the Florida Panhandle. As the slow-moving storm crept west, it sucked up tremendous amounts of tropical moisture from the Gulf of Mexico. Downpours increased as the storm moved closer to Louisiana. Regions in Louisiana and nearby Mississippi received more than six inches of rain on Thursday, August 11. The next day a continuous downpour soaked Baton Rouge, submerging the state capital in 11.24 inches of rain. Even greater amounts came down in other parts of the state. On August 13, the nearly stationary area of low pressure continued to wring moisture from the Gulf, dumping more than 10 inches on sodden areas of Louisiana. At the close of the weekend, August 14, scores of cities in the region could measure total rainfall in feet. The unnamed storm would eventually shower Louisiana with an estimated 7.1 trillion gallons of water — more rain than Hurricane Isaac in 2012, and three times as much rain as Hurricane Katrina in 2005.
With the deluge came catastrophic inland flash flooding and river flooding. More than a half-dozen rivers in southeast Louisiana broke records, not just by inches but by feet. The Amite River in Magnolia, Louisiana crested at 58.56 feet, more than six feet above the old mark established on April 27, 1977.
Figure 1 shows the total three-day rainfall which occurred from August 12 to the 14. This quantity represents the meteorological variable that best captures the event.


Analysis
The goal of this analysis is to present the first quantitative estimate of the role climate change plays — both in terms of frequency and intensity — in an extreme precipitation event like the one experienced this August in south Louisiana.
To assess the potential link between the extreme amount of precipitation that fell over three days across parts of Louisiana and human-caused climate change, Climate Central, the National Oceanic and Atmospheric Administration’s Geophysical Fluid Dynamics Laboratory (GFDL), Princeton University and the Royal Netherlands Meteorological Institute (KNMI) — as part of the World Weather Attribution (WWA) partnership which also includes Red Cross Red Crescent Climate Centre, the University of Oxford and University of Melbourne, conducted independent assessments using multiple peer-reviewed approaches.
This analysis draws on well-established, regularly-used methodologies for extreme event attribution. These approaches involve statistical analyses of the historical extreme precipitation record and simulations from two high-resolution climate models. Applying multiple methods provides scientists with a means to assess confidence in the results.
While the flooding event of interest occurred in south Louisiana, for the purposes of our analysis we defined the extreme event by taking the spatial maximum of annual three-day averaged precipitation anywhere in the land areas of the region: 29º-31ºN and 85º-95ºW – we refer to this in the text as the Central U.S. Gulf Coast region. That said, the complex meteorology and climatology of the region presents unique challenges due to the many different forms in which extreme precipitation reaches the Central U.S. Gulf Coast region (for example, hurricanes, frontal systems, and thunderstorms). The analysis therefore takes into account all the ways that extreme precipitation can occur.
Observational data analysis
The daily precipitation data in the study is drawn from 324 stations from the Global Historical Climatology Network (GHCN-D), as well as gridded analysis from the National Oceanic and Atmospheric Administration (NOAA) Climate Prediction Center (CPC) Unified Gauge-Based Analysis of Daily Precipitation. The methodologies used to analyze these data are well-established and were previously applied to the rapid attribution of the May 2016 French and German flooding event (see here for more details). Precipitation extremes are expected to be of smaller magnitude in the gridded product, as was the case in this analysis, the three-day maxima was 21 inches (535 mm) in the CPC gridded versus 25 inches (648 mm) in the point station data.
Modelling analysis
Many of the systems that result in extreme precipitation in this region are small-scale, so only high-resolution models are capable of simulating them realistically. To complete the modeling component of this analysis, the team relied on two high-resolution climate models developed at the National Oceanic and Atmospheric Administration (NOAA) Geophysical Fluid Dynamics Laboratory (GFDL): FLOR-FA (50km resolution) and HiFLOR (25 km), that were both sufficiently able to capture the physical processes underlying this very extreme event. These models were also selected because they provide long simulations, which offered the team good statistics that cover hundreds of years of simulations. Making a rapid attribution study of new simulations was impossible in the time frame required, since high-resolution models typically take 24 hours of computer time to simulate just five years of climate data.
Table 1 describes the seven global coupled model experiments performed using the FLOR-FA and HiFLOR climate models using different radiative forcing regimes. The prescribed radiative forcing includes the solar forcing, both anthropogenic and natural aerosols, well-mixed greenhouse gases, and ozone. Five of the experiments look at specific “time slices” meant to represent our climate system at various points in history. These simulations are denoted by the term “static radiative forcing” in Table 1. The pre-industrial period is captured by looking at a time slice of the climate representative of 1860. Time slices of 1940, 1990 and 2015 were also analyzed as a way to compare our climate before human influence with various points along the industrialization pathway.
In addition to the time slice analyses, the team also looked at a set of “time-varying radiative forcing” experiments from 1861-2100. These experiments serve as another way to assess the role of climate change. The HiFLOR time-varying radiative forcing experiment uses an ‘SST-restoring’ technique to force modeled sea surface temperatures to follow the variability and change observed in the real climate system.
Table 1: Climate model simulations performed with the FLOR-FA and HiFLOR models.
| Model | Type of Forcing | Representative Year of Forcings | No. of Ensembles | No. of Modelled Years in Total |
|---|---|---|---|---|
| FLOR-FA | Static radiative forcing | 1860 | 1 | 3550 |
| FLOR-FA | Time-varying radiative forcing | 1861-2100 | 5 | 1200 (5 realisations of 240 years) |
| HiFLOR | Static radiative forcing | 1860 | 1 | 200 |
| HiFLOR | Static radiative forcing | 1940 | 1 | 75 |
| HiFLOR | Static radiative forcing | 1990 | 1 | 300 |
| HiFLOR | Static radiative forcing | 2015 | 1 | 70 |
| HiFLOR | Time-varying radiative forcing, SST-restored to observed climatology | 1971-2015 | 6 | 270 (6 realisations of 45 years) |
The length of these simulations vary from 70 years up to 3550 years (Table 1, last column). Long simulations are necessary to allow the models to generate their own climate and provide a sufficient number of years to sample the statistics of climate extremes.
Results
A Central U.S. Gulf Coast extreme precipitation event has become more likely and more intense in 2016 than it was in 1900 as a result of climate change. Analyses based on observational precipitation data found clear positive trends in rainfall frequency and intensity. Simulations from two high-resolution global climate models show positive, but somewhat smaller trends. This confirms that a large part of these trends are due to climate change, including the long-term warming of the planet resulting from human activities such as burning fossil fuels. The magnitude of the shift in probabilities is greater in the higher resolution (25 km) HiFLOR climate model than the somewhat lower resolution (50 km) FLOR-FA model. The summary table below provides results from each of the different approaches used.
Based on these different approaches – all of which are in agreement – the team found that human-caused climate change increased the frequency and intensity of the heavy rains such as the August 12 – 14 event along the Central U.S. Gulf Coast region.
Overall change in risk – frequency & intensity
By comparing recent three-day precipitation extremes for the Central U.S. Gulf Coast region with the historical record and climate model simulations, the team found that an event like this is now expected to occur at least 40 percent more often than it was in our pre-industrial past. Precipitation intensity increased by roughly 10 percent as a result of human-caused climate change.
Return time
The probability for a comparable three-day extreme precipitation event at a single station as high as what was observed August 12-14 (25.5 inches) is somewhere between a 1-in-450 year and a 1-in-1450 year event. However, it is important to note that it wasn’t the maximum rainfall at a single station that resulted in such catastrophic flooding, it was the total rainfall over the entire affected area. Hence, our best estimate, given the relatively short data record, is that this event is best characterized as a 1-in-550 year event locally.
In contrast, an event like this currently occurs somewhere along the Central U.S. Gulf Coast region about once every 30 years (between 11 and 110 years). To put this local versus regional return time difference in perspective, the chance of getting struck by lightning for each person is one in a million per year, but every year 300 people are struck by lightning in the United States.
By the end of the current century, if greenhouse gases continue to increase as projected, their impact will further increase the probability of an event like the one observed August 12th-14th.
The extreme rainfall in south Louisiana has longer-term implications for homeowners, local and federal governments, the humanitarian system, and the insurance industry. Knowing that this type of event is occurring more frequently today than in the past provides valuable insight into how governance and humanitarian institutions will need to evolve to be prepared for the future. It demonstrates that estimates of present and future risk of the most extreme events should incorporate information about the changing nature of risk, in interpreting the relevance of the historical occurrence of these events.
Scientific parameters
| Variable | Central U.S. Gulf Coast region: Precipitation |
|---|---|
| Event definition | 3-day maximum average precipitation as high as recorded on August 12th-14th 2016 or higher. |
| Domain | Central U.S. Gulf Coast region: land area of 29º-31ºN, 85º-95ºW |
| Observational data | GHCN-D station data 1891-presentCPC 0.25º analysis gridded data 1948-present |
| Models used | Model #1: FLOR (Vecchi et al. 2014; Jia et al. 2015; Jia et al. 2016) — resolution is ~50km/30mi in the atmosphere/land, ~100km/60mi in the ocean/sea ice.
Model #2: HiFLOR (Murakami et al. 2015; Van der Wiel et al. 2016) — resolution is ~25km/16mi in the atmosphere/land, ~100km/60mi in the ocean/sea ice. |
| Results | Central U.S. Gulf Coast region: The probability of a 3-day precipitation extreme like the event observed August 12th-14th occurring anywhere in the Central Gulf Coast region has increased and the increase is due to human-caused climate change. In our expert judgement and drawing upon results from multiple peer-reviewed methods, the increase in probability is at least 40% – but it may be much larger. The increase in probability corresponds to an increase in intensity of roughly 10%.
By the end of the current century, if greenhouse gases continue to increase as projected, their impact will further increase the probability of an event like the one observed August 12th-14th. Observations: GHCN-D station data 1891-present: Frequency: roughly 6 times increased chance (2-50) CPC 0.25º analysis gridded data 1948-present: Frequency: very roughly 5 times increased chance (1.1-60) FLOR historical (1900-2015, using data from 1861-2015): Frequency: roughly 1.3 times increased chance (1.0 – 1.9) FLOR historical+future (1900-2015 but using data from 1861 up to 2100): Frequency: roughly 1.8 times increased chance (1.4 – 2.0) HiFLOR time slices (1860, 1940, 1990, 2015): Frequency: roughly 2 times increased chance (1.4-2.5) HiFLOR historical (1900-2015, extrapolated from data 1971-2015): Frequency: roughly 2.4 times increased chance (1.3-8) |


