Skip to content
World Weather Attribution header
  • Home
  • About
    • FAQs
    • Methods
    • Information for journalists
  • Analyses
    • Drought
    • Extreme rainfall
    • Heatwave
    • Storms
    • Cold spells
    • Wildfire
    • Study tracker
    • By year
  • News
  • Peer reviewed research
    • Methodological papers
    • Event papers
follow us on Bluesky
Previous image
Next image

argentina-figure1

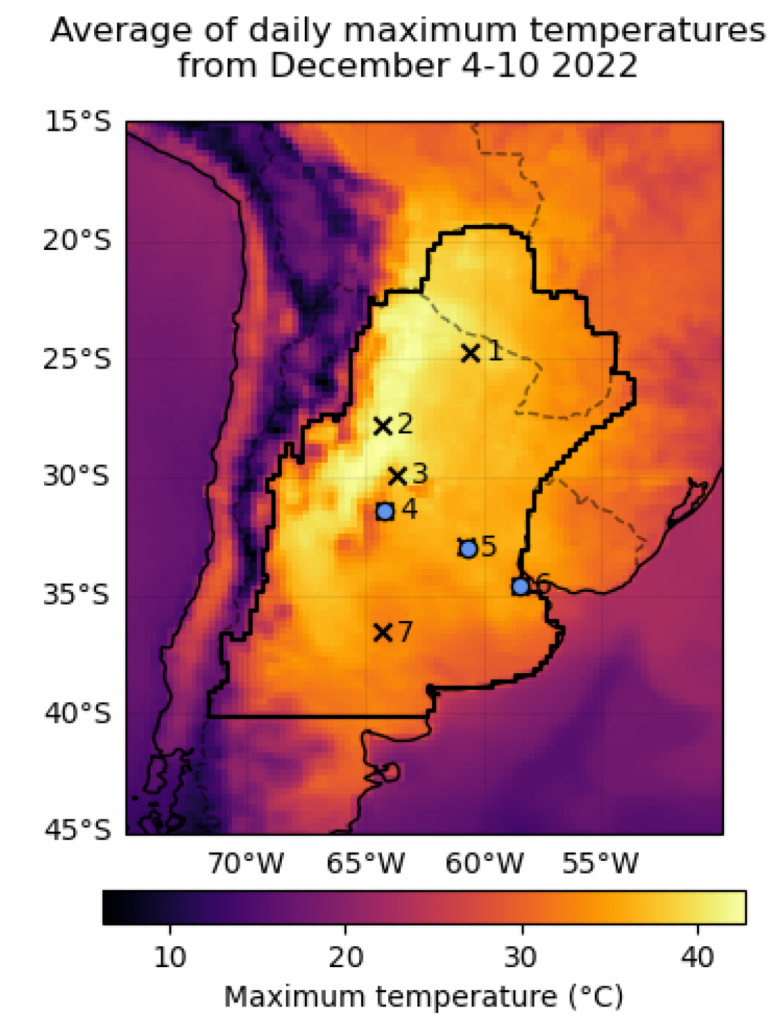
Figure 1: ERA5 near surface temperature (T2m) [℃] showing 7-day average daily maximum for the period of the 4th to 10th of December 2022. The bold black outline represents the study region, the blue dots represent major cities Buenos Aires (station 6), Rosario (station 5), Córdoba (station 4) and the crosses indicate the weather stations analysed in this report.

Posted on 21 December 202221 December 2022 Full size 1150 × 1512

Post navigation

Published inargentina-figure1

Recent Posts

  • Increasing heavy rainfall and extreme flood heights in a warming climate threaten densely populated regions across Sri Lanka and the Malacca Strait
  • Human-induced climate change compounded by socio-economic water stressors increased severity of 5-year drought in Iran and Euphrates and Tigris basin
  • Heavy rainfall leading to widespread flooding in eastern Mexico disproportionately impacts highly exposed Indigenous and socially vulnerable communities
  • Climate change enhanced intensity of Hurricane Melissa, testing limits of adaptation in Jamaica and eastern Cuba
  • Ten Years of the Paris Agreement: The Present and Future of Extreme Heat

Categories

  • Cold spells
  • Drought
  • Extreme rainfall
  • Heatwave
  • News
  • Storms
  • Wildfire
World Weather Attribution Logo

About

  • Contact us
  • About this site
  • Cookies
  • Privacy policy
  • Accessibility

Partners

  • Imperial College London
  • Royal Netherlands Meteorological Institute (KNMI)
  • Red Cross Red Crescent Climate Centre