
From mid April and advancing into May, India and Pakistan experienced extremely high temperatures, including daily maximum temperatures above 46°C in many cities in India (Times of India, 2026).
This ongoing period of extreme heat brought severe human and economic impacts across India and Pakistan (Al Jazeera, 2026), two of the most densely populated regions in the world, exposing hundreds of millions of people to dangerous conditions. At least 37 heat-related deaths were reported in India (The Wire, 2026), while ten deaths were recorded in Karachi, Pakistan (Tribune, 2026). The event also drove record-high electricity demand across India as cooling needs surged (The Wire, 2026), while agricultural drought conditions affected over 1mio km² (GDACS, 2026), compounding risks to food production and livelihoods. Beyond these direct impacts, the heat coincided with major election periods in the region, raising concerns about voter safety, campaign disruptions, and broader pressures on public infrastructure and health systems (The Times of India, 2026) while potentially taking attention away from the acute dangers of heat.
According to the IPCC AR6, based on many studies, there is a well-established and robust link between anthropogenic climate change and the increasing frequency, intensity, and duration of extreme heat events in South Asia, making such episodes significantly more likely in today’s warmer climate (Seneviratne et al., 2021). With World Weather Attribution, we have also undertaken several attribution studies on extreme heat events in India and South Asia, including May 2024, April 2023, March to May 2022 and May 2016 when temperatures of over 50°C were reached in Phalodi, Rajasthan. While the more recent studies have shown a strong increase in likelihood and intensity of extreme dry and humid heat in the region, the 2016 study did show smaller increases. The study, published in a peer-reviewed journal (van Oldenborgh et al., 2018) concluded that “for the next decades we expect the trend due to global warming to continue but the surface cooling effect of aerosols to diminish as air quality controls are implemented”. A decade on, we perform a super-rapid attribution study that updates the 2022 attribution analysis, as this year’s heatwave affected broadly similar regions and reached a comparable spatial extent. We also examine how the likelihood and intensity of an event such as this one have changed in today’s climate as compared with the 2016 climate conditions, when a similarly severe heat event occurred in the region, against a backdrop of ENSO and widespread drought.
Key Messages
- While both India and Pakistan have invested in Heat Action Plans (HAPs) that do prevent deaths, but can lack context specific implementation guidelines and thus extreme heat continues to cause deaths and disproportionately exposes deep social inequalities. Outdoor workers, people living in poor-quality housing, and those dependent on daily wages are significantly more vulnerable to heat-related illness and mortality. In addition, since heatwaves are not a notified/ declared disaster in India and Pakistan, they are often ineligible for disaster relief funding.
- When analysing gridded observational-data products, we find that in today’s climate this event is no longer rare, with a return period of approximately 5 years. In other words, there is a 20% chance in any given April of experiencing temperatures comparable to the hottest 15-day period observed in April 2026. This contrasts with the 2022 event, which was considerably rarer because it was a longer event that occurred earlier in the season with comparatively more extreme temperatures.
- To increase the amount of data available and better assess the role of climate change in the observed changes, we combined observational records with simulations from 19 climate models that passed model validation. Our analysis concludes that human-caused climate change made this 15-day heatwave both hotter and significantly more likely. In particular, climate change approximately tripled the probability of an event like the 2026 heatwave. The same event would have been about 1°C cooler in a preindustrial climate.
- It is important to highlight that the increase in both the likelihood and intensity of extreme temperatures in April is much greater than in May. This means that people in India, Pakistan, and across South Asia are now facing a much longer period of extreme heat, with the risk of intense dry heat in the earlier months compounded by humid heat during the pre-monsoon period, as a result of human-induced climate change. This brings severe consequences for health, agriculture, and the economy, even before the monsoon begins.
- We also combine climate models and observation-based products in the same way to study changes in only the past 10 years, during which time the world has warmed by approximately 0.4°C. In this short time, we find an increase in intensity of such heat events by 0.3°C and an increase in likelihood of about 35%.
- With future warming, climate models project that such an event will become substantially more likely and intense compared to present day, indicating that periods like late April 2026 will quickly become a cool pre-monsoon season. Given an additional 1.3°C of warming, such events will become more than twice as likely again and another 1.2°C hotter.
- We also analysed changes in the single hottest day in April with observations only. We found that the hottest April day in 2026 over the study region was again approximately a 1 in 5 year event. The results of the trend analysis are also very similar to the 15-day analysis, with similar events now about 20 times more likely and about 1°C hotter. This result was also stronger than analysis of the hottest day in both April and May each year, suggesting that such hot days are occurring earlier.
- These changes in the temperature of heatwaves are lower than for many other regions of the world. This is likely due to the combined effect of atmospheric aerosols and increased irrigation of the land surface in recent years, partially offsetting warming due to greenhouse gases. However, a concurrent rise in relative humidity due in part to these same drivers means that dangerous humid heat is still rapidly rising in the region, in line with the findings of several other attribution and climate analyses.
- India has invested in heat action plans and built an increasingly comprehensive heat-response system, focussing on emergency management. Considering the increasingly dangerous temperatures a focus on proactive adaptation planning on long-term climate resilience and urban retrofitting and redesign are needed, in addition to emergency response.
Overview of heatwaves in India and Pakistan
As set out briefly above, there is a well-established and robust link between anthropogenic climate change and the increasing frequency, intensity, and duration of extreme heat events in South Asia, making such episodes significantly more likely in today’s warmer climate (Seneviratne et al., 2021). Several World Weather Attribution studies have assessed the anthropogenic influence on specific hot events in the pre-monsoon season in recent years, including: March-April mean daily maximum temperatures in 2022 over a region covering northwestern India and Pakistan, which were found to be approximately 30 times more likely and 1°C hotter (Zachariah et al., 2022; Zachariah et al., 2023), which was found to be robust to different treatments of natural variability (Nath et al., 2024); 4-day humid heat in April 2023 over a region covering most of coastal and eastern India and Bangladesh, which was found to have been made more than 30 times as likely and about 2°C hotter (in ‘Heat Index’; Zachariah et al., 2023); mean April temperatures in 2024 in a large region stretching from India to Vietnam based on observation-based data were found to be about 45 times as likely and 0.85ºC hotter (Zachariah et al., 2024).
This work is in line with the wider literature on changes and projections in extreme heat in the region, with an observed increase in duration, frequency and severity of heatwaves across most regions of India (Gupta et al., 2025; Rohini et al., 2016), which can be attributed to anthropogenic forcings including emissions and land use change (Kishore et al., 2022), as well as clear increases in both maximum and minimum temperatures in Pakistan (Khan et al., 2019). These trends are observed in spite of sources of cooling in the region, including widespread irrigation and relatively high atmospheric aerosol concentrations, especially over western India (Ajay et al., 2023; van Oldenborgh et al., 2018). However, while such anthropogenic factors may partially counter the warming influence of greenhouse gases, they also lead to a net increase in surface relative humidity, which can in turn amplify net heat stress (Ajay et al., 2023; van Oldenborgh et al., 2018). Projections using a variety of climate models also find further increases in heatwave frequency and intensity with further global warming, as well as earlier onset and delayed cessation due to more persistent geopotential height anomalies (Jayasankar et al., 2026), and often due to both amplified temperature and humidity conditions (Molina et al., 2026). Future increases in extreme heat are also projected for Pakistan using high resolution regional climate models (Saeed et al., 2017).
Analysis of trends in extremes
Event definition
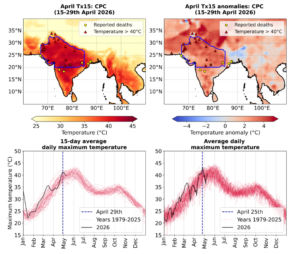
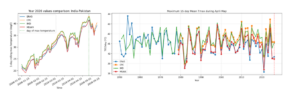
The 2026 spring season in northwestern India and Pakistan is characterised by distinct sequences of hot extremes, with the earliest hot spell reported in February and continuing into March. This was followed by a cooler interval associated with western disturbances, culminating in the recent, more intense heat episode since mid-April. The top left panel in Figure 1 shows this event, with several locations witnessing temperatures over 40°C and also cases of heat-related deaths.
In order to capture the impact from this relatively early episode of intense heat, in this short analysis we examine trends in both maximum 1-day and 15-day averaged daily maximum temperatures in April, over a region spanning Pakistan and northwestern India (Fig. 1), henceforth Tx1x and Tx15x, respectively. This region corresponds with the highest anomalies observed during this period (top right panel, Fig. 1) and was previously used in a rapid attribution study for the extreme heat in March-April 2022 (Zachariah et al., 2022; Zachariah et al., 2023), allowing direct comparison and reference to those results as set out above. We further examine the same indices for the months of April and May combined, to test the sensitivity in our results and explore how hot season events are changing more broadly (shown in Appendix).
The methods used to analyse heat trends follow the standard WWA protocol using non-stationary extreme value theory, as described in Philip et al. 2020 and expanded upon in Otto et al., 2024. Specifically, the extremes indices Tx1x and Tx15x are modelled using a generalised extreme value (GEV) distribution that is assumed to shift with global mean surface temperature. A more detailed description of this method and an example can be found in Clarke et al., 2026. In this study we conduct an observation-only analysis for Tx1x and combine observation-based gridded products and climate models for Tx15x (data described in the Appendix). In line with the protocol described in Philip et al. 2020, climate models are evaluated in their representation of observed weather and climate characteristics of the region.
Results
Trends in observation-based data
15-day April maxima
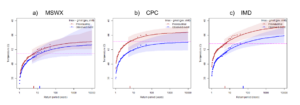
Two observation-based datasets (CPC and MSWX) that include the event and known to satisfactorily represent observed conditions in this region are used to determine the return period of the event in the current climate. We use the gridded dataset created from weather station records from India Meteorological Department (IMD) as the third dataset. However, we note that this data is available only within the administrative boundaries of India, but the spatial extent and the climatological homogeneity of the study region justifies the use of this product for validating the other products, and as a third independent dataset (Figure A1).
Table 1 summarises the results from fitting a non-stationary GEV that linearly scales with GMST to the April 15-day maxima temperature( TX15day) area-averaged over the study region. We find that such an event has a return period of 5 years in the present climate, consistent across all three datasets. We note that we first tested two models to assess the drivers of extreme temperature events in the study region-(1) a non-stationary GEV models that scales linearly with GMST and (2) a non-stationary GEV model that scales with GMST and and the detrended Niño3.4 (NinoDJF) index. Assessments based on Akaike Information Criterion confirmed that the inclusion of NinoDJF did not explain the variability in TX15day events in this region and therefore not considered further.
The trends suggest an increase in the likelihood and intensity of TX15day events such as the 2026 event in April, in all three datasets. While CPC and IMD suggest that events of similar rarity have been made hotter by approximately 1.2- 1.3℃ since the pre-industrial climate, MSWX suggests a more modest increase of 0.5℃. The Probability Ratio (PR) and intensity changes since 2016 also suggest 75-80% increase in the likelihood of such events in today’s climate in the last 10 years and that such events have become roughly 0.4℃ hotter, again with much smaller changes in MSWX.
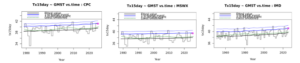
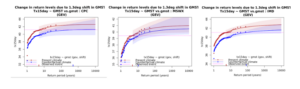
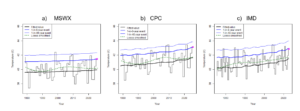
All fitted statistical models show a good fit to the respective datasets, with the trends broadly representative of the loess smoothed trends (Fig. 2), and the return curves matching the shape of the distribution, especially at the likelihood of the event itself (Fig. 3). All distributions show the same behaviour with respect to the datasets, with a slight underestimate of very low and very high values, and a slight overestimate of moderate values (Fig. 3). This may be related to the use of a generalised extreme value distribution for a rolling 15-day mean within a 30-day period. However, a gaussian distribution was also tested and the GEV was found to have a better fit, according to the Akaike Information Criterion, as well as better representing the extreme values.
| Dataset | Event magnitude (°C) | Return period | Change since preindustrial | Change since 2016 | ||
| Probability ratio | Change in magnitude (°C) | Probability ratio | Change in magnitude (°C) | |||
| CPC | 41.06 | 5.43
(2.83 to 25.46) |
15.41
(2.15 to Inf) |
1.18
(0.30 to 2.01) |
1.75
(1.24 to 2.44) |
0.36
(0.09 to 0.62) |
| MSWX | 39.45 | 4.81
(2.22 to 28.57) |
2.19
(0.20 to 117.72) |
0.50
(-0.93 to 1.97) |
1.23
(0.54 to 1.83) |
0.15
(-0.29 to 0.61) |
| IMD | 41.16 | 4.88
(2.13 to 68.59) |
101.90
(0.49 to Inf) |
1.34
(-0.31 to 3.03) |
1.82
(0.82 to 25.96) |
0.41
(-0.10 to 0.93) |
Table 1: Estimated return periods of Tx15x events over the study region in IMD, MSWX and CPC, as well as probability ratio and change in magnitude with increasing GMST. Both changes since the preindustrial period and since 2016 are shown.
1-day April maxima
We also study the 1-day maxima (TX1day) in April in the same region using the same datasets, as described above. We find that the 1-day event was also approximately a 5 or 6 year event in the present climate, again consistent across datasets (Table 2). We also find comparably good fits to the data using a GEV distribution that shifts with GMST (Figs. 4 & 5). In this case, there is more evidence of a multi-decadal variability in the index, as indicated by the smoothed loess trend (Fig. 4), though higher variability is to be expected for a shorter-duration extreme.
Again, the trends suggest an increase in the likelihood and intensity of TX1day events such as the 2026 event in April in all three datasets. MSWX shows the weakest change in likelihood, with an approximate doubling and large uncertainty commensurate with no clear change (0.1 to 8000), CPC and IMD both suggest very strong increases, with a statistically significant increase by a factor of 10 (2 to 600) in IMD and an even stronger (but not significant change) in CPC. Equivalently, while CPC and IMD suggest that events of similar rarity have become approximately 1.2 – 1.4℃ hotter since the pre-industrial climate, MSWX suggests a more modest increase of 0.5℃. When synthesised, these results suggest an overall increase in likelihood by a factor of ~20, and increase in intensity by 1°C, in line with other results for heat events in the region. Similarly, when synthesising changes since 2016, we find an approximate 70% (-40% to +580% ) increase in the likelihood of such events in today’s climate, and that such events have become roughly 0.3℃ (-0.2°C to +0.8°C) hotter.
| Dataset | Event magnitude (°C) | Return period | Change since preindustrial | Change since 2016 | ||
| Probability ratio | Change in magnitude (°C) | Probability ratio | Change in magnitude (°C) | |||
| IMD | 42.85 | 5.31 | 10.15
(2.22 to 577.22) |
+1.26
(+0.43 to +2.16) |
1.73
(1.26 to 2.43) |
+0.39
(+0.13 to +0.66) |
| MSWX | 41.45 | 6.03 | 2.17
(0.14 to 8420*) |
+0.45
(-1.22 to +1.90) |
1.23
(0.48 to 2.17) |
+0.14
(-0.37 to +0.58) |
| CPC | 43.12 | 6.32 | 577.22*
(0.41 to 1.65E+12*) |
+1.37
(-0.30 to +2.68) |
2.35
(0.75 to 37.31) |
+0.42
(-0.09 to +0.82) |
| Synthesis | – | – | 23.32
(0.03 to 7.56E+6) |
+1.03
(-0.68 to +2.59) |
1.71
(0.62 to 6.78) |
+0.32
(-0.21 to +0.80) |
Table 2: Estimated return periods of Tx1x events over the study region in IMD, MSWX and CPC, as well as probability ratio and change in magnitude with increasing GMST. Both changes since the preindustrial period and since 2016 are shown, as well as the synthesised changes across the datasets. ‘*’ indicates that an infinite value has been replaced (see Otto et al., 2024).
Hazard synthesis
| Present – Preindustrial | Present – 2016 | Future – Present | ||||
| Probability ratio
(95% C.I.) |
Intensity change (°C)
(95% C.I.) |
Probability ratio
(95% C.I.) |
Intensity change (°C)
(95% C.I.) |
Probability ratio
(95% C.I.) |
Intensity change (°C)
(95% C.I.) |
|
| Observations | 15.1
(0.11 to 186000) |
+1.01
(-0.58 to +2.60) |
1.57
(0.72 to 5.26) |
+0.31
(-0.18 to +0.80) |
||
| Models | 2.31
(0.19 to 48.3) |
+0.80
(-0.67 to +2.27) |
1.28
(0.76 to 2.25) |
+0.24
(-0.20 to +0.70) |
2.38
(1.43 to 3.92) |
+1.19
(+0.38 to +2.00) |
| Synthesis | 2.94
(0.16 to 242) |
+0.89
(-0.63 to +2.42) |
1.35
(0.74 to 2.88) |
+0.27
(-0.19 to +0.74) |
||
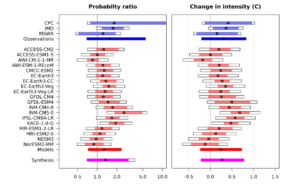
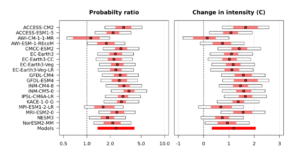
Table 3: Summary of results for probability ratio and change in intensity for April Tx15x, presented in Figs. 6-8: changes due to GMST include past-present changes for both preindustrial and 2016 reference periods, and present-future changes. Statistically significant changes at the 95% level are also highlighted in bold font.
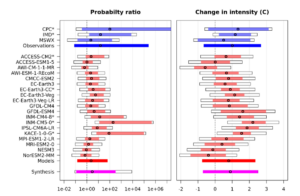
The synthesised results show clearly that 15-day heat events in the study region in northwestern India and Pakistan are increasing significantly in both likelihood and intensity with global warming. Observational and reanalysis datasets estimate that the likelihood of such an event has increased by a factor of approximately 15 with a large uncertainty range, or equivalently that the intensity of a 1-in-5-year event has increased by 1.0°C (-0.6 to +2.6°C). The model synthesis gives slightly lower estimates, with the likelihood of such an event increased by a factor of approximately 2.3 (0.2 to 48), or equivalently that the intensity of a 1-in-5-year event has increased by 0.8°C (-0.7 to +2.3°C). Synthesising the estimates from observations and models, we find that this event has increased in likelihood by a factor of approximately 3 (0.2 to 240), or equivalently that the intensity of a 1-in-5-year event has increased by 0.9°C (-0.6 to +2.4°C).
It is also clear that such events are becoming more likely and intense on very short-lived timescales as the world warms. Since 2016, when the world was approximately 0.4°C cooler than present day, observations suggest that similar events to this have become around 1.6 (0.7 to 5.3) times more likely, and equivalently that the intensity of a 1-in-5-year event has increased by 0.3°C (-0.2 to 0.8°C). Synthesising this with climate models, we find that anthropogenic climate change in the past 10 years has increased the likelihood of such events by a factor of approximately 1.4 (0.7 to 2.9), or equivalently has increased the intensity of a 1-in-5-year event by 0.3°C (-0.2 to 0.7°C). Finally, with an additional 1.3°C of warming from present, present-day 1-in-5-year events will be an additional 2.4 (1.4 to 3.9) times more likely, and equivalently 1.2°C (0.4 to 2.0°C) hotter.
The observed and attributable changes in maximum temperature in this region are lower than the mean global warming rate and also lower than the changes in very recent heat extremes found in many other regions, including North America (Clarke et al., 2026; Philip et al., 2022); Australia (Clarke et al., 2026); Europe: (Zachariah et al., 2022); Central Asia (Clarke et al., 2025). As described in the section ‘Overview of heatwaves in India and Pakistan’, this is likely due to the influences of high aerosol concentrations and land use changes such as increased irrigation in the region, both of which provide a cooling influence. However, this does not necessarily mean that the danger of heat is increasing any less rapidly in this region. First, the same factors that dampen the warming trend cause a near surface increase in relative humidity, which amplifies head stress due to people’s reduced ability to thermoregulate through sweating. This is shown clearly by the stronger findings of attribution studies of heat indices, such as the ‘Heat Index’, which directly take humidity into account (e.g. Zachariah et al., 2023). Second, our sensitivity analysis of 15-day high temperatures in April and May show weaker changes than April alone (see Appendix), suggesting that there is a more rapid increase in early season heat, which is known to be the most dangerous, and that the season for dangerously high levels of heat is lengthening.
Vulnerability & Exposure
The pre-monsoon season in South Asia (SA) is often marked by heatwave conditions in India and Pakistan. In 2015, for example, India and Pakistan recorded 2,300 and 1,200 deaths respectively due to extreme heat, with the most severely affected regions including Andhra Pradesh, Telangana, Punjab, Odisha, Bihar, and Karachi (IMD, 2025; NDMA, 2025). India and Pakistan collectively host 1.7 billion people (World Bank Group, 2024). Older adults, daily wage earners, outdoor workers, people with pre-existing conditions and those living and working in informal sectors are often more susceptible to heat stress (Zachariah et al., 2024; Saeed et al., 2026). Above normal temperatures in these countries have disrupted livelihoods, strained agricultural systems and energy demand, and adversely affected public health. In 2026, 37 deaths in India and 10 in Pakistan have been recorded so far, with outdoor activity as the predominant risk factor (Khan, 2026; The Wire, 2026). However these early estimates tend to rise over time, as additional data on excess mortality is calculated in addition to the deaths directly attributed to heat. Understanding vulnerability and exposure is thus essential to avoid potential impacts and deploy interventions to manage heat stress in these regions (Zachariah et al., 2023).
An analysis of district-level vulnerability data in India identifies that regions with low levels of infrastructure, urbanization, literacy, access to water, sanitation and household amenities have higher heat vulnerability and mortality risk (Azhar et al., 2017). Indoor heat is also a key issue, with conventional brick and concrete buildings reaching over 45C indoors in Pakistan, Punjab during the hottest months, according to one study (Akram et al., 2026). Disparities in exposure arising from gender roles linked with socioeconomic vulnerabilities serve as critical factors contributing to the disproportionately higher impacts of heat on women in south Asia (Zachariah et al., 2023; Tiwari et al., 2022). Relative humidity also acts as a compounding factor in Indus and Ganges river valley regions characterized by a significant number of people involved in outdoor agricultural activities (Prabhu et al., 2025; Im et al., 2017; Lin et al., 2018).
This year, in India, the heatwave coincided with the state assembly elections in Assam, Kerala, Tamil Nadu, West Bengal, and Puducherry from 9 April to 29 April (Press Information Bureau, 2026). Additionally, the Census-2027 was scheduled to begin on 1 April which included door-to-door surveys (Press Information Bureau, 2026). A large number of officials deployed for election duties, voters, and more than 3 million enumerators, supervisors, and other officials were involved in Census operations, exposing them to high temperatures during peak hours (Ambarkhane, 2024; Press Information Bureau, 2026). Although these regions are not part of the study domain (Figure 1), they highlight the broader heat-related impacts during this period. In Pakistan, the deaths reported near mosque areas also highlight vulnerabilities in public and religious spaces under scorching conditions coupled with limited cooling systems, overcrowding and reduced ventilation (Khan, 2026). With rising extreme temperatures and urbanization, built up areas have grown rapidly, leading to loss of green cover which is a natural defense against heat. In Karachi, studies show declining vegetative cover in the central urban region (Afzal, 2025) and concrete surfaces in Tier I and Tier II cities like Mumbai, and Delhi trap heat during the day and release it at night, thus (Prabhu et al., 2025) amplifying the urban heat island effect (Panda et al. 2024). Furthermore, rising air pollution acts as a compounding factor by exacerbating health conditions related to extreme heat in this region (World Bank, 2023).
To reduce the impact of heatwaves in India, cooling zones are set up in New Delhi for people to take refuge from extreme heat along with a mobile cooling unit (The Tribune, 2026). These zones have cooling systems, hydration stations, cool storage (refrigerators), oral rehydration solution and first aid kits (NDMA, 2025). Comprehensive guidelines on precautions and protective measures against heatwaves, early warning systems, Heat Action Plans (HAPs) in various states, the India Cooling Action Plan (2019), Heatwave Management Plan (Lahore) and the National Action Plan on Heat-Related Illnesses (2024) provide frameworks to reduce risks. However, these frameworks sometimes lack context-specific implementation, and long-term adaptation considerations (WRI, n.d.; The Urban Unit, 2022). Since heatwaves are not a notified/ declared disaster in India and Pakistan, they are often ineligible for disaster relief funding. In Pakistan, non-government organizations are also developing anticipatory action systems as risk reduction measures (Amad & Riaz, 2025). Furthermore, the effectiveness of heat action plans and mitigation measures strongly depends on risk perception, public awareness and behavioral response (Wolf et al., 2010).
Appendix
Data
The datasets used in this study are as follows:
- IMD – gridded dataset of observed daily maximum temperature at 0.5° x 0.5° resolution for the period from January 1, 1951 to 30 April 2026, provided by the Indian Meteorological Department (IMD; Srivastava et al., 2009). Its spatial extent is limited to within the geographical borders of India.
- MSWX – The Multi-Source Weather dataset (Beck et al., 2022), which combines various observational and reanalysis-based data (including ERA5) for reliable bias-corrected weather variable estimates, at 3-hourly intervals from 1979 to near real-time, and at 0.1° spatial resolution globally. We use daily maximum temperature data from this product.
- CPC – We use the daily maximum and daily minimum temperatures from the gridded product from NOAA PSL, Boulder, Colorado, USA known as the CPC Global Unified Daily Gridded data, available at 0.5° x 0.5° resolution, for the period 1979 – 10 May 2026. Data are available from NOAA.
- GMST data – As a measure of anthropogenic climate change we use the (low-pass filtered) global mean surface temperature (GMST), where GMST is taken from the National Aeronautics and Space Administration (NASA) Goddard Institute for Space Science (GISS) surface temperature analysis (GISTEMP, Hansen et al., 2010 and Lenssen et al. 2019).
- CMIP6 – This consists of simulations from 111 realisations of 31 participating models with varying resolutions. For more details on CMIP6, see Eyring et al., (2016). For all simulations, the period 1850 to 2015 is based on historical simulations, while the SSP5-8.5 scenario is used for the remainder of the 21st century.
April-May analyses
15-day April-May maxima
Due to the timing of the event in the latter half of April, when in general temperatures are still ascending to plateau around May to mid June before the cooling limb begins due to the monsoons, we focus on the month of April as the seasonal extent. This highlights the exceptionality of the observed Tx15day and Tx1day for that month. However, some of the most recent impacts were reported in the first week of May. Therefore, we additionally tested an alternate definition focusing on the same indices but including events across the two months, April and May, as the season. With this definition we find that the observed Tx15day and T1day events are very common with the return period decreasing from 5 years for April to 1.5 years (2 out of 3 years) for the April-May season. The PRs and intensity changes are also smaller, implying less pronounced climate change signals. This sensitivity to the inclusion of May suggests that contrasting processes may be influencing temperature variability including evolving circulations associated with the onset of the monsoons, among other factors (see section Overview of heatwaves in India and Pakistan) . This warrants further investigation into the roles of thermodynamic warming and dynamical changes in shaping heat extremes during this transitional period.
| Dataset | Event magnitude (°C) | Return period | Change since preindustrial | Change since 2016 | ||
| Probability ratio | Change in magnitude (°C) | Probability ratio | Change in magnitude (°C) | |||
| IMD | 41.1 | 1.28
(1.09 to 1.67) |
1.31
(0.92 to 1.87) |
0.52
(-0.14 to +1.18) |
1.07
(0.97 to 1.13) |
0.16
(-0.04 to +0.36) |
| CPC | 41.2 | 1.26
(1.07 to 1.87) |
1.66
(0.76 to 4.52) |
0.89
(-0.43 to +2.13) |
1.12
(0.91 to 1.23) |
0.27
(-0.13 to +0.66) |
| MSWX | 39.5 | 1.12
(1.00 to 1.41) |
0.99
(0.75 to 1.32) |
-0.07
(-1.47 to +1.50) |
1.00
(0.86 to 1.03) |
-0.02
(-0.45 to +046) |
Table A1: Estimated return periods of April Tx15x events over the study region in CPC, IMD and MSWX, as well as probability ratio and change in magnitude with increasing GMST. Both changes since the preindustrial period and since 2016 are shown.
| Present – Preindustrial | Present – 2016 | Future – Present | ||||
| Probability ratio
(95% C.I.) |
Intensity change (°C)
(95% C.I.) |
Probability ratio
(95% C.I.) |
Intensity change (°C)
(95% C.I.) |
Probability ratio
(95% C.I.) |
Intensity change (°C)
(95% C.I.) |
|
| Observations | 1.29
(0.65 to 2.73) |
+0.45
(-1.02 to +1.94) |
1.06
(0.88 to 1.20) |
+0.14
(-0.31 to +0.60) |
||
| Models | 1.76
(0.52 to 7.31) |
+0.87
(-0.34 to +2.08) |
1.15
(0.92 to 1.45) |
+0.27
(-0.10 to +0.64) |
1.36
(1.20 to 1.53) |
+1.10
(0.37 to 1.83) |
| Synthesis | 1.39
(0.60 to 3.57) |
+0.70
(-0.62 to +2.03) |
1.09
(0.89 to 1.29) |
+0.22
(-0.19 to +0.62) |
||
Table A2: Summary of results for probability ratio and change in intensity for April & May Tx15x, presented in Figs. 6-8: changes due to GMST include past-present changes for both preindustrial and 2016 reference periods, and present-future changes. Statistically significant changes at the 95% level are also highlighted in bold font.
1-day April-May maxima
| Dataset | Event magnitude (°C) | Return period | Change since preindustrial | Change since 2016 | ||
| Probability ratio | Change in magnitude (°C) | Probability ratio | Change in magnitude (°C) | |||
| IMD | 42.85 | 1.56 | 1.59
(0.94 to 2.70) |
+0.58
(-0.07 to +1.19) |
1.12
(0.98 to 1.22) |
+0.18
(-0.02 to +0.37) |
| MSWX | 41.45 | 1.17 | 1.13
(0.75 to 2.02) |
+0.44
(-0.98 to +1.98) |
1.03
(0.89 to 1.08) |
+0.13
(-0.30 to +0.61) |
| CPC | 43.12 | 1.71 | 1.94
(0.46 to 11.72) |
+0.62
(-0.70 to +1.95) |
1.18
(0.73 to 1.50) |
+0.19
(-0.22 to +0.60) |
| Synthesis | – | – | 1.52
(0.59 to 4.59) |
+0.55
(-0.60 to +1.72) |
1.11
(0.83 to 1.33) |
+0.17
(-0.18 to +0.53) |
Table A3: Estimated return periods of Tx1x events over the study region in IMD, MSWX and CPC, as well as probability ratio and change in magnitude with increasing GMST. Both changes since the preindustrial period and since 2016 are shown, as well as the synthesised changes across the datasets.
Authors
Mariam Zachariah, Centre for Environmental Policy, Imperial College, London, UK
Ben Clarke, Centre for Environmental Policy, Imperial College, London, UK
Claire Bergin, ICARUS Climate Research Centre, Maynooth University, Ireland
Arulalan T, India Meteorological Department, Ministry of Earth Sciences, Gov. of India
Fahad Saeed, Climate Analytics, Germany; Weather and Climate Services, Islamabad, Pakistan
Vedanshee Pundeer, Red Cross Red Crescent Climate Centre, The Hague, the Netherlands; based in Delhi, India
Maja Vahlberg, Red Cross Red Crescent Climate Centre, The Hague, the Netherlands; Swedish Red Cross, Stockholm, Sweden
Friederike Otto, Centre for Environmental Policy, Imperial College, London, UK
Review authors
Joyce Kimutai, Centre for Environmental Policy, Imperial College, London, UK


