The river basin contains the largest rainforest in the world, making it a global hotspot of biodiversity and a key part of the global hydrological and carbon cycle. The river levels are reported to be at lowest levels in 120 years, threatening the estimated 30 million people living in the Amazon basin across several nations including Brazil, Peru, Colombia, Venezuela, Ecuador and Bolivia, by disrupting transportation, isolating communities and killing wildlife.
The large riverine system powers significant portions of the affected countries’ energy through hydropower, with Brazil relying on hydro power for 80% of its electricity, Colombia 79%, Venezuela 68%, Ecuador and Peru 55%, and Bolivia 32% (USaids, 2018). The drought is significantly impacting dam capacities and energy output and led to power cuts in the region as early as June 2023.
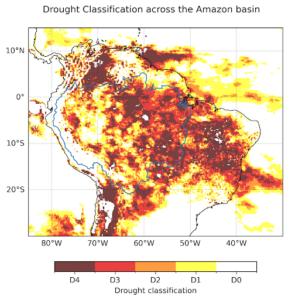
Scientists from Brazil, the Netherlands, the UK and the US used published peer-reviewed methods to assess whether and to what extent the drought has been influenced by climate change as well as the occurrence of El Niño, which is known to be associated with drought in the Amazon. While the drought started earlier in the west of the basin, the whole basin has been in severe or exceptional drought for the second half of the year (Fig. 1 blue outline).
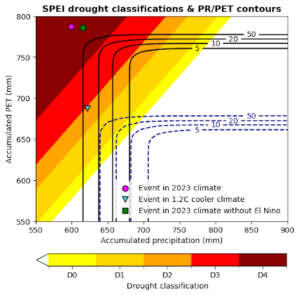
There are several ways to characterise a drought. Meteorological drought considers only low rainfall, while agricultural drought combines rainfall estimates with evapotranspiration. Increased evapotranspiration due to regional warming can play a major role in exacerbating drought impacts. In this study we assess agricultural drought as well as meteorological drought. The main variable used here to characterise agricultural drought is the Standardised Precipitation Evapotranspiration Index (SPEI) (figure 1) which uses the difference between rainfall and potential evapotranspiration to estimate the available water. The more negative the values are, the more severe the drought is classified. Meteorological drought is analysed here using an index (SPI) based on precipitation alone.
Main findings
- Highly vulnerable populations were disproportionately affected by the drought. Small-holder farmers, indigenous-, rural- and river communities across the region were among the most vulnerable due to high poverty rates and their high dependency on agricultural food production, availability of freshwater, and import of goods via rivers.
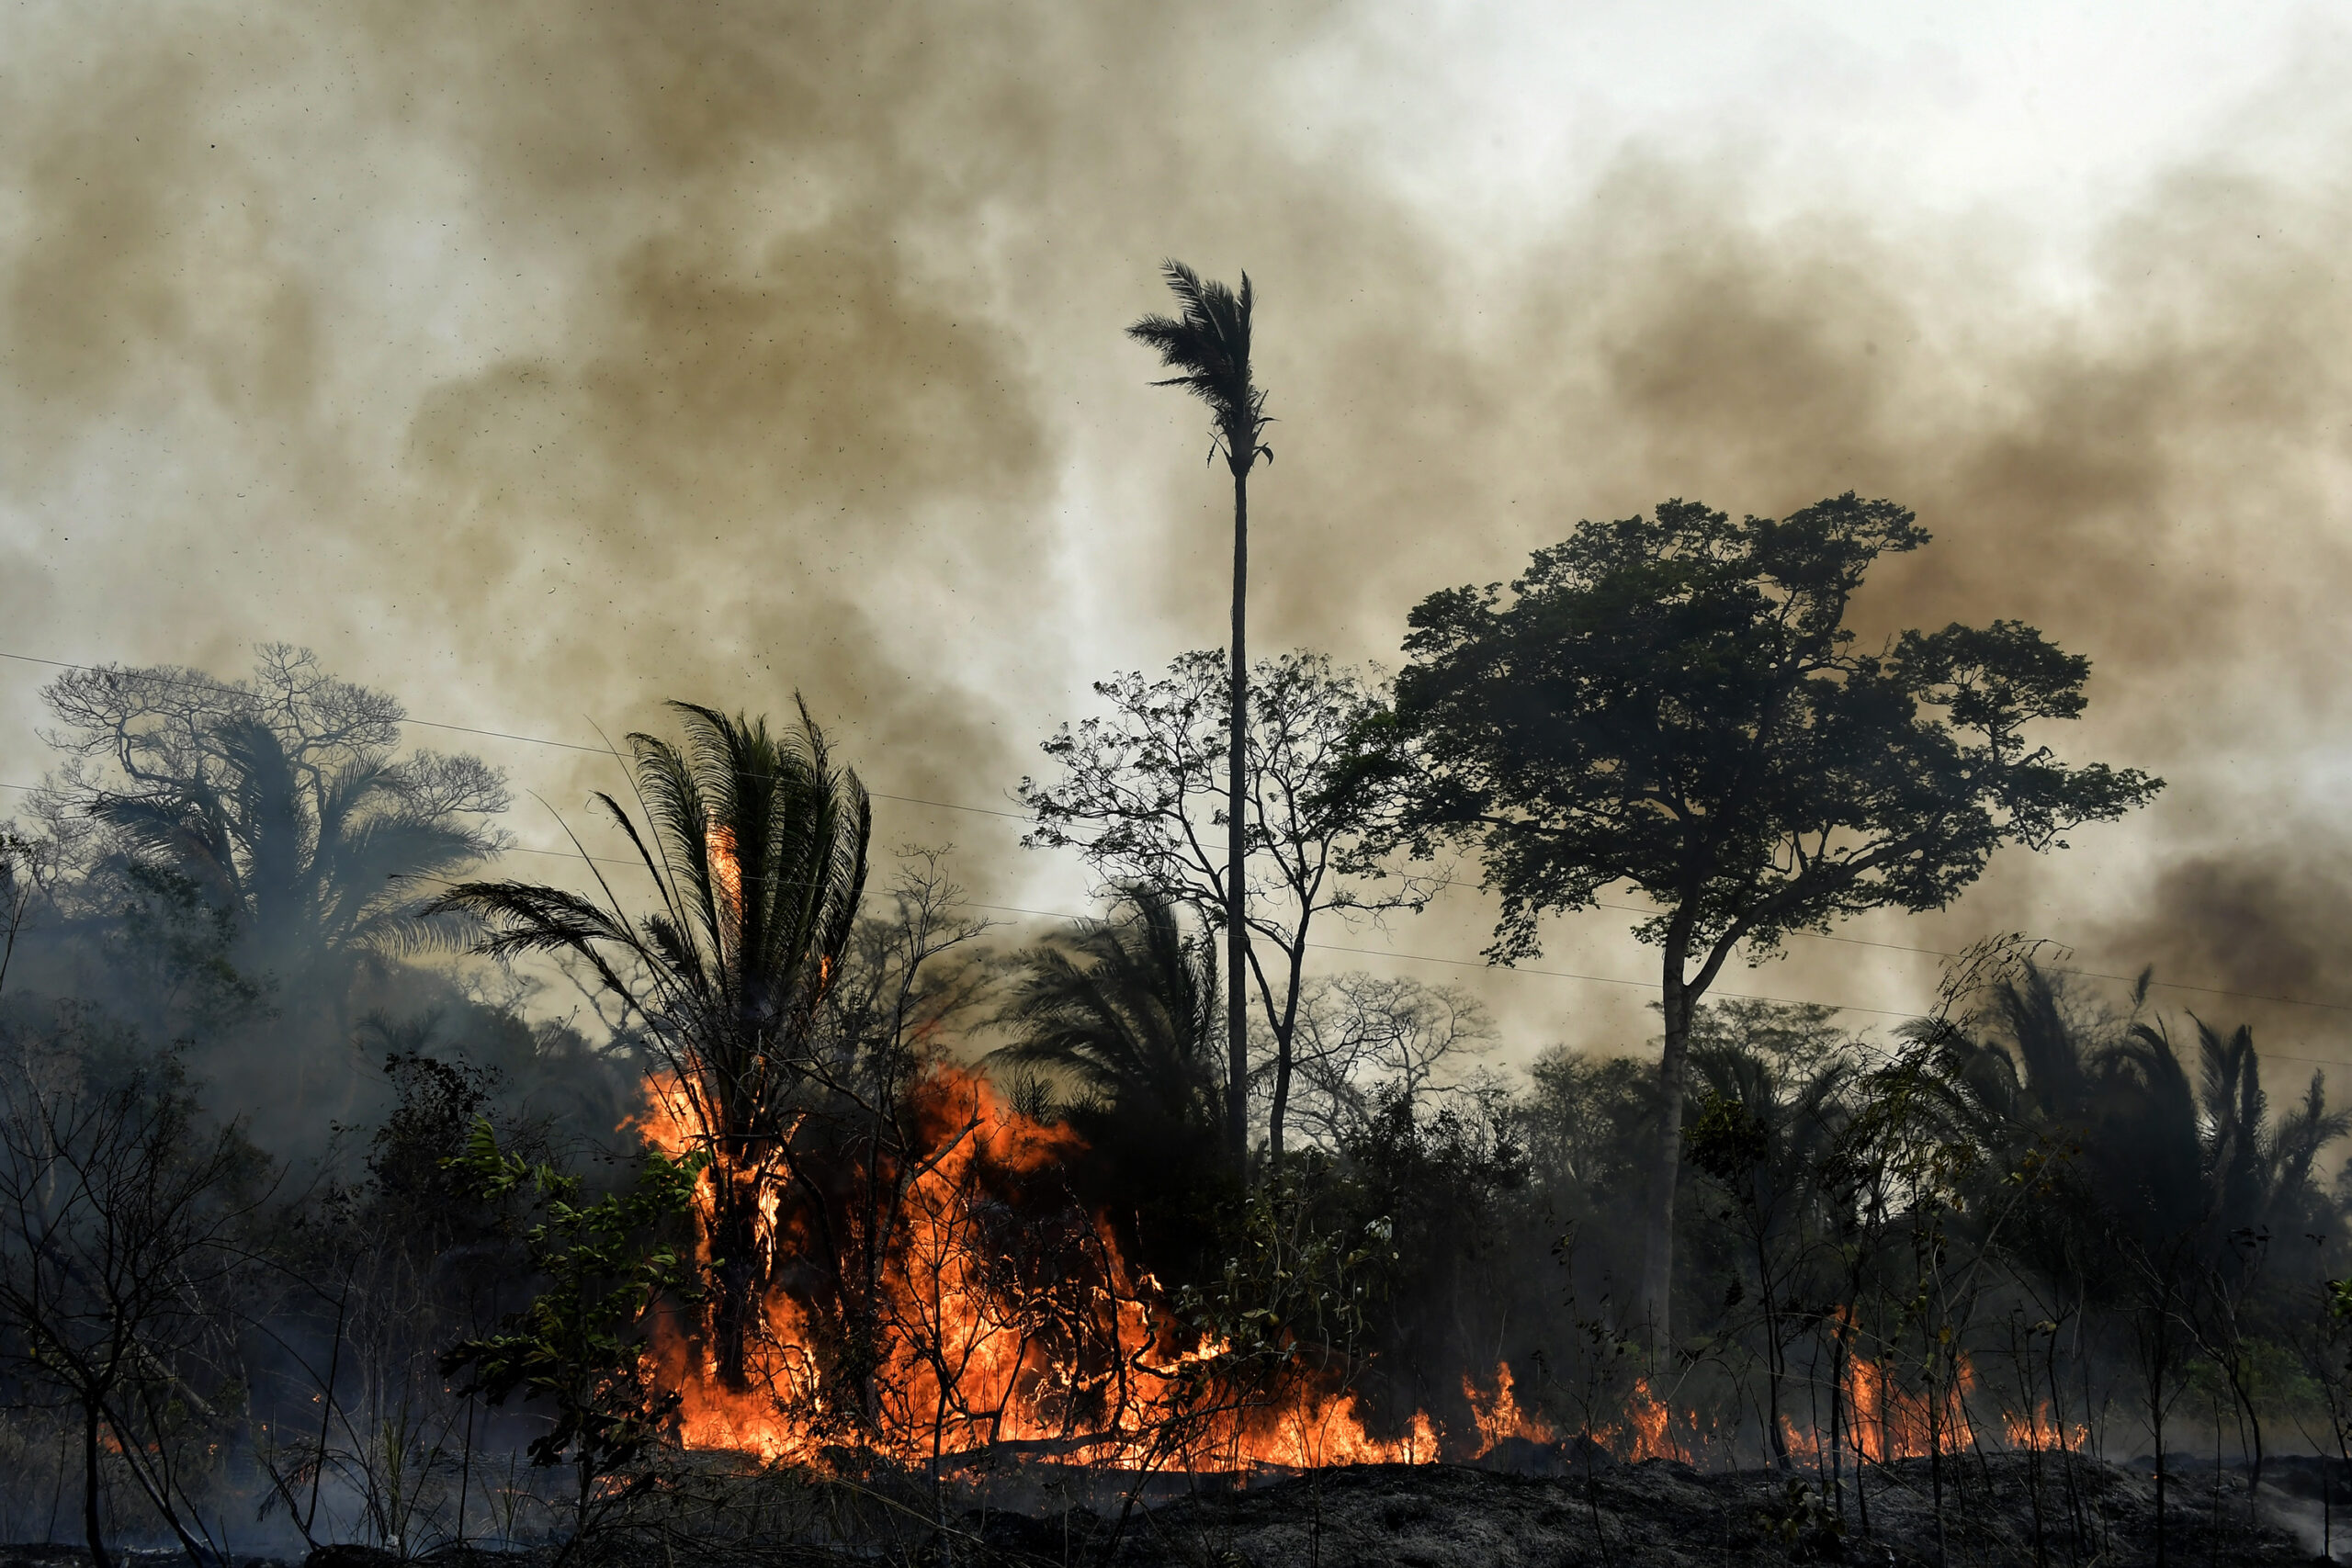
- Exposure to drought impacts was compounded by historical land, water, and energy management practices including deforestation, destruction of vegetation, fires, biomass burning, corporate farming, cattle ranching and other socio-climate problems which have decreased the water and moisture retention capacity of the land and thus worsened drought conditions.
- In datasets based on weather records the drought is exceptional, even in today’s climate, characterised as a 1 in 100 year event for the meteorological drought (SPI) and approx. a 1 in 50 year event in SPEI. While there is a strong drying trend in the meteorological drought, the trend in agricultural drought is even stronger meaning this agricultural drought would have been extremely rare in a cooler climate.
- We first assess to what extent El Niño is a driver of this trend. El Niño reduced the amount of precipitation in the region by about the same amount as climate change; however, the strong drying trend was almost entirely due to increased global temperatures, so the severity of the drought currently being experienced is largely driven by climate change.
- In order to assess whether and to what extent human-induced climate change was a driver of this drought we combine observations-based data products and climate models and look at the 6 month meteorological (SPI6) drought as well as agricultural drought (SPEI6). We find that the likelihood of the meteorological drought occurring has increased by a factor of 10, while the agricultural drought has become about 30 times more likely.
- Using the US drought monitoring classification system, based on agricultural drought, this means that what is now classified an exceptional drought (D4), would have only been a ‘severe drought’ (D2) without the effects of climate change, caused by burning fossil fuels and deforestation.
- Unless the world rapidly stops burning fossil fuels and deforestation, these events will become even more common in the future. In a world 2°C warmer than preindustrial an event like this would become even more likely by a further factor of 4 for the agricultural drought (every 10-15 years) and a further factor of 3 for the meteorological drought (every ~30 years).
- While all countries in the affected region have drought management plans, the recent droughts indicate a need to reform policy and better integrate proactive support for forecasts and early warnings, drought contingency plans, sustainable water management practices and infrastructure investment to cope with future, more intense droughts.
- These results highlight that despite ‘low confidence’ in IPCC projections for drought in the region, increasing water stress driven by human-induced climate change as well as other systemic factors continues to be a major threat for the population and requires urgent efforts for more effective water management strategies, interdisciplinary humanitarian response, and regional cooperation that includes farmers and other stakeholders in the planning.


