
In particular, the all-time temperature record at a station in metropolitan France (old record 44.1°C in Conqueyrac, Gard) was broken on June 28, with a new record of 45.9°C, more than 1.5°C above the previous, was established at Gallargues-le-Montueux, Gard, near the city of Nîmes. Numerous June records and all-time records at single stations were broken in other countries such as Czech Republic, Spain and Switzerland. In Switzerland new June records were confirmed at more than 40 stations, and new all-time records were confirmed at 6 altitude stations. In Austria and the Netherlands, the whole month of June 2019 was the warmest ever recorded, in a large part due to the heatwave.
Here we present an analysis of the role of human activities in the heatwave, conducted in near real time by using well assessed methodologies. The analysis is not yet peer-reviewed and was written quickly, albeit by scientists experienced in event attribution, working with experts familiar with the conditions in the region studied. We used thoroughly tested methods to do the analysis, evaluation of models and checked the observations for errors.
Key findings
- Every heatwave occurring in Europe today is made more likely and more intense by human-induced climate change. How much more depends very strongly on the event definition: location, season, intensity and duration.
- We use an event definition that focuses on health impacts, the three-day average of daily mean temperature. We considered two spatial scales: the whole of France and one city, Toulouse. We only consider June heatwaves because they have a different impact and different trend from heatwaves in July and August.
- The observations show a very large increase in the temperature of these heatwaves. Currently such an event is estimated to occur with a return period of 30 years, but similarly frequent heatwaves would have likely been about 4 ºC cooler a century ago. In other words, a heatwave that intense is occurring at least 10 times more frequently today than a century ago.
- Climate models have systematic biases in representing heatwaves at these scales and show smaller trends, more year-on-year variation and fewer really severe heatwaves than the observations. They simulate an increase in probability of a factor of 2 to 20.
- Heatwaves are deadly, although this is not readily visible at the time. This risk is aggravated by climate change, but also by other factors such as an aging population, urbanisation, changing social structures, and levels of preparedness. The full impact is only known after a few weeks when the mortality figures have been analysed. Heat plans have reduced the impact in France and other countries, and are becoming even more important in light of the rising risks.
Vulnerability and exposure
In France, extreme heatwaves usually occur in mid-summer, when they have less impact on school days and on professional activities than in June or September. Due to the heat in June 2019, the government decided to postpone one national exam, inducing organisational challenges at large scale.
However, the most striking impact of heatwaves, increased mortality, is generally only reported later (with the exception of immediate deaths such as due to drowning when people seek cooling). This “excess mortality” beyond the normal mortality in this period of the year (often taking account of reduced mortality in the following weeks) is calculated on statistical analysis of reported deaths over a longer period of time. This generally means that heatwave mortality, while very significant compared to other disasters in terms of numbers of people killed, often attracts much less public attention that, for instance, deaths due to floods or storms. After 2003 heat plans have been made to better prepare for heatwaves and reduce mortality. These were activated during the 2019 heatwave, and probably helped to reduce the impacts. Better preparedness was also facilitated by the accurate forecast, long in advance, of the National weather service, Météo-France. For instance, a, all-time national record temperature was correctly forecast (to within 1 degree) by forecasters at least three days in advance.
Event definition
Despite the headlines being grabbed by the record breaking maximum temperatures, we define the event over a period of three days — as the highest 3-day averaged daily mean temperature in June (TG3x). The daily temperature is taken as the average over France and at the city of Toulouse in southern France. These choices were motivated as follows.
The daily mean temperature is a better indicator of health impacts than the maximum or minimum temperature. In the observations it is affected less by local factors such as changing ventilation, as the effects on maximum and minimum temperatures have opposite signs. In models, it is also more robust than the maximum temperature. In addition, multi-day heatwaves have proportionally larger health effects in Europe, and three days is a length that captures this reasonably well. Many heat plans are triggered with a 3-day criterion.
We also just looked at the occurrence of heatwaves in the month of June. Early season heatwaves have a more severe impact than similarly hot heatwaves in high summer as the holiday season has not yet begun, so people have less opportunity to avoid the highest temperatures.
And finally, given that health impacts are local, we took a station in the affected area. Most of the authors happened to be at a conference on extreme events and climate change in Toulouse, a city also forecasted to reach record temperatures, so that was a logical choice. Indeed Touloyse recorded its all time highest night temperature and the highest maximum temperature for June. We are mainly interested in showing differences between a country average and a single place, so we chose Toulouse and compare this particular city with the often used metropolitan France measure (i.e., France without the overseas departments), which has less local influences.
Analysis
In this article we analyse a country average as in previous analyses of high temperatures in western Europe as well as a single station (Toulouse) as in last year’s analysis of heat in northern Europe.
Observations
We firstly analyse observed temperatures and estimate how rare the current heatwave is, measured as June maximum of three-day mean temperatures (TG3x), and whether or not there is a trend toward increasing temperature. As appropriate for our event definition, we fit a Generalized Extreme Value Distribution (GEV), described by three parameters: the position parameter μ, the scale parameter σ and the shape parameter ξ.
In this statistical approach, global warming is factored in by allowing the fit to the distribution to be a function of the western European summer temperatures to capture also the effect of aerosols which is important in this heatwave index and not present in global mean surface temperatures which would normally be the choice of co-variate.
This effect is for example described in van Oldenborgh et al, 2009 .
Fitting the time series over France and Toulouse to a Generalised Extreme Value function that shifts in proportion to the European summer temperature, we obtain a good description of 3-day heat in France with large heatwaves around 1950, fewer towards the 1970s and even more the last decades. This fit shows how often in today’s climate such an event is to be expected and how often it would have been expected around 1901. We find that the observations show very roughly a factor 100 increase, with a lower bound of a factor 10. We then estimate the increase in heatwave temperature since 1901, which appears to be about 4 ºC in June.
It has often been shown that summer temperatures increase due to climate change, so we know that climate change plays a role, in this analysis we find out how much the magnitude and likelihood of heatwaves have increased locally in a country and in a city for this particular event. Local effects of soil moisture feedbacks are very strong, thus the quantitative impact of climate change is very different depending on the location, time of the year and exact definition of “heatwave”.
Models
To assess the role of climate change, we compare observations with results from climate models that are available and suitable for the temperatures in these locations. This answers the question whether and to what extent external drivers, in particular human-caused climate change, can explain the temperature trends in the observational data. We utilise different methodologies as in previous studies, but expanded the range of analysis approaches.
Before undertaking the attribution analysis using climate models we have to evaluate whether the models readily available to us are fit for purpose and represent the statistics of the TG3x June event well.
To evaluate these models we test whether the statistics of extreme heat in these models corresponds to the observed statistics. The test consists of fitting the models to the same GEV distribution as in the observations and comparing the scale (σ) and shape (ξ) parameters of the fits to the model data with the parameters of the fits described in the section observational analysis. We do not consider the position parameter as biases in this parameter can easily corrected without affecting the overall results.
Most models show considerably different behaviour with respect to the quantitative increase in likelihood and severity, compared to the observations so the confidence in the quantitative modelling results in this study is low, compared with other studies. All models and observations qualitatively agree on a strong human influence in increasing heatwave risk. There is thus high confidence in the sign (increase) of the human contribution to the heatwave risk
Hazard synthesis
We summarise the results from the observations and the climate models, answering the questions how much the probability and severity of an event like this (or more severe) have changed due to anthropogenic climate change.
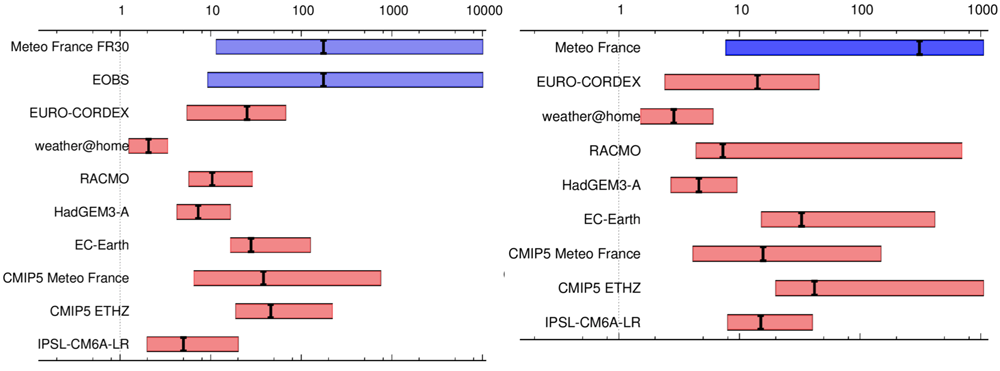
The change in probability (Probability Ratio, PR) is shown in figure 1. First and foremost, the observations and almost all models show a large increase in the probability of heatwaves like the one observed in June 2019 (as described by the 3-day mean temperature, both averaged over all of France and in one specific city, Toulouse).
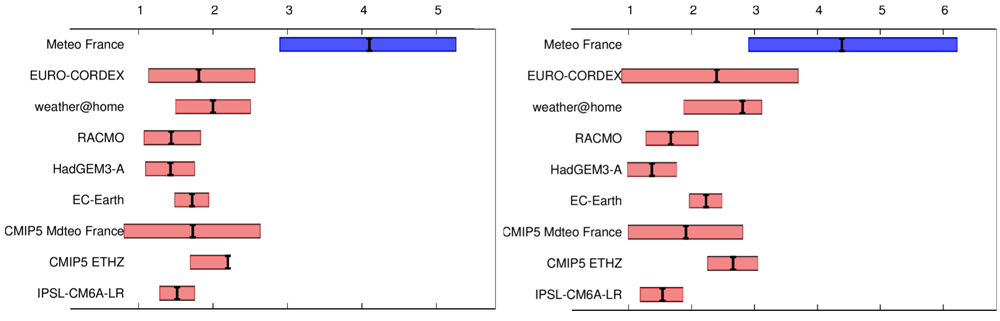
For the average over France we find that the probability has increased by at least a factor five (excluding the model with very strong bias in variability). However, the observations show it could be much higher still, a factor 100 or more. Similarly, the observed trend in temperature of the heat during an event with a similar frequency is around 4 ºC, whereas the climate models show a much lower trend.
We note that while we are very confident about the positive trend and the fact that the probability has increased by at least a factor five, it is much more difficult to assign one specific number (a “best guess” based on all models and observations) on the extent of the increase, given the large uncertainties in the observed trends (due to the relatively short time series from 1947-2019) and systematic differences between the representation of extreme heatwaves in the climate models and in the observations.
For one city, Toulouse, the results are very similar although with somewhat larger uncertainties.
For more information, download the full study (pdf, 32 pages, 1.8 MB)


