Skip to content
World Weather Attribution header
  • Home
  • About
    • FAQs
    • Methods
    • Information for journalists
  • Analyses
    • Drought
    • Extreme rainfall
    • Heatwave
    • Storms
    • Cold spells
    • Wildfire
    • Study tracker
    • By year
  • News
  • Peer reviewed research
    • Methodological papers
    • Event papers
follow us on Bluesky
Previous image
Next image

japan-wettest-day-anomalies

Maps showing the relative anomlaies of the wettest day of the year in 2018 and 2012

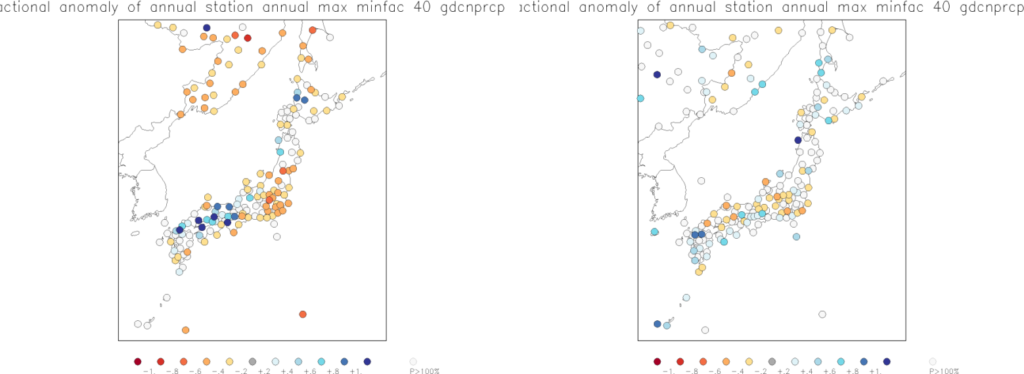
Figure 5. Relative anomalies of the wettest day of the year (RX1day) in 2018 (left) and 2012 (right). A value of zero denotes an extreme like the long-term average; a value of one (dark blue), twice as much rainfall on the wettest day than the long-term average.

Posted on 25 July 201825 July 2018 Full size 1559 × 570

Post navigation

Published injapan-wettest-day-anomalies

Recent Posts

  • Record-shattering March temperatures in Western North America virtually impossible without climate change
  • Unplanned urbanisation fuels landslide disasters amid emerging rainfall trends
  • Increasingly severe rainstorms put people and structures built on floodplains at risk
  • Climate change fuels the destruction of world’s oldest trees
  • La Niña, Climate change, high exposure and vulnerability combined led to devastating floods in parts of Southern Africa

Categories

  • Cold spells
  • Drought
  • Extreme rainfall
  • Heatwave
  • News
  • Storms
  • Wildfire
World Weather Attribution Logo

About

  • Contact us
  • About this site
  • Cookies
  • Privacy policy
  • Accessibility

Partners

  • Imperial College London
  • Royal Netherlands Meteorological Institute (KNMI)
  • Red Cross Red Crescent Climate Centre