Skip to content
World Weather Attribution header
  • Home
  • About
    • FAQs
    • Methods
    • Information for journalists
  • Analyses
    • Drought
    • Extreme rainfall
    • Heatwave
    • Storms
    • Cold spells
    • Wildfire
    • Study tracker
    • By year
  • News
  • Peer reviewed research
    • Methodological papers
    • Event papers
follow us on X
follow us on X
Previous image
Next image

cape-town-fig1

Anomalies in precipitation in Cape Town region, 2015–2017

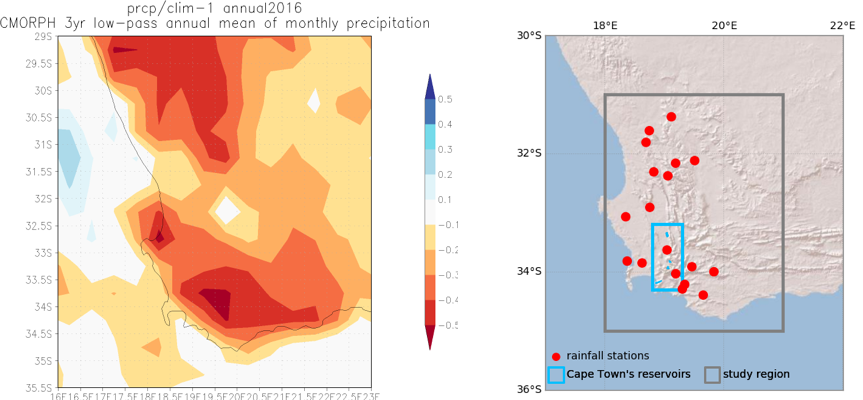
Figure 1 a) Anomalies of the 2015–2017 precipitation in this region relative to 1998–2014 b) The study region (grey square) and the location of the reservoirs (blue square)

Posted on 25 July 201825 July 2018 Full size 863 × 400

Post navigation

Published incape-town-fig1

Recent Posts

  • Climate change turns warm summer days in England into health threat
  • Climate change drives record-breaking heat in Iceland and Greenland challenging cold adapted ecosystems and societies
  • Mixed rainfall trends highlight the importance of climate adaptation in coastal New South Wales
  • Heat Action Day Report: Climate Change and the Escalation of Global Extreme Heat
  • Effective emergency management prevented larger catastrophe after climate change fueled heavy rains in Central Mississippi river valley

Categories

  • Cold spells
  • Drought
  • Extreme rainfall
  • Heatwave
  • News
  • Storms
  • Wildfire
World Weather Attribution Logo

About

  • Contact us
  • About this site
  • Cookies
  • Privacy policy
  • Accessibility

Partners

  • Imperial College London
  • Royal Netherlands Meteorological Institute (KNMI)
  • Red Cross Red Crescent Climate Centre