
Key findings
- The summer of 2017 was marked by extreme heat in Southern Europe.
- Scientists with World Weather Attribution (WWA) conducted a multi-method attribution analysis to assess whether and to what extent human-caused climate change played a role in both the record hot summer (June–August) across the Euro-Mediterranean region and three-day heat waves such as the early August heat wave dubbed Lucifer.
- In many towns and cities across the Euro-Mediterranean region there is now around a 1 in 10 chance every year for heat waves at least as hot as those in the summer of 2017.
- The team found that climate change increased the chances of seeing a summer as hot as 2017 by at least a factor of 10 and a heat wave like Lucifer by at least a factor of four since 1900.
- If greenhouse gas emissions continue to increase in the atmosphere, a summer like that of 2017 will be normal in the Euro-Mediterranean region by the middle of the century.
Introduction
This year’s summer in Western Europe and the Euro-Mediterranean region has been remarkable in several aspects. Early summer heat during much of June affected western European countries (in particular, France, Switzerland, Belgium, the Netherlands, England, Portugal and Spain). In July, the heat returned to southern Spain. Madrid (Retiro) hit 40.6°C (105°F) on July 13, equal to the record set in 2012. Heat wave episodes continued into August, spreading to Southern Europe. Early August saw a particularly intense heat wave in southeastern countries, with local maximum temperatures in Italy and the Balkans topping 40°C (104°F) for several days. Temperature records were broken in Southern France (Nîmes, Courbessac, 41.6°C/106.9°F) for example, and in Corsica and Croatia, where night-time temperatures remained above 30°C (86°F). Southern Poland also made headlines with abnormally high August temperatures. The heat combined with high humidity was described as the “worst heat wave since 2003” (BBC) in southern countries. Taking the summer months together, this resulted in a hot summer as a whole. In France, for instance, the mean summer temperature was ranked second after 2003 and just above that of 2015.
In terms of impacts, Southern Europe is familiar with warm summers with very hot days. It is the sustained extreme temperatures that become hazardous, particularly for the very young and elderly and those suffering from heart conditions, high blood pressure and asthma (RCCC), or tourists who are unaccustomed to high temperatures and more likely to be outdoors. High energy and water consumption during prolonged heat waves also puts a strain on supplies.
There have been some reports of deaths associated with the August heat wave, but usually the full extent of the impact is only evident later after analysing and attributing the total mortality excesses (see e.g., D’Ippoliti et al, 2010). Increased hospital admissions with people suffering from heatstroke, burns and other heat-related conditions were reported during the 2017 heat wave.
Also in August, forest fires were reported in Albania, Serbia, Bosnia, Macedonia and Croatia, Greece, and Italy, with Albania requesting aid from the European Union and several countries evacuating tourists from the affected zones. More than 60 people are reported to have died from the forest fires in Portugal that occurred earlier in June.
The agricultural industry has borne the brunt of the hot and dry summer season, with Bosnia reporting a loss of half its normal agricultural output and an associated 10% reduction in its economic income, and Serbia predicting up to a one-third reduction in corn and soybean production (Reuters), and Italy expecting an agricultural-sector loss of billions (Express). In Italy, grape harvests (New York Times) were carried out weeks earlier than usual to lower the risk of sun and heat damage to the grapes.
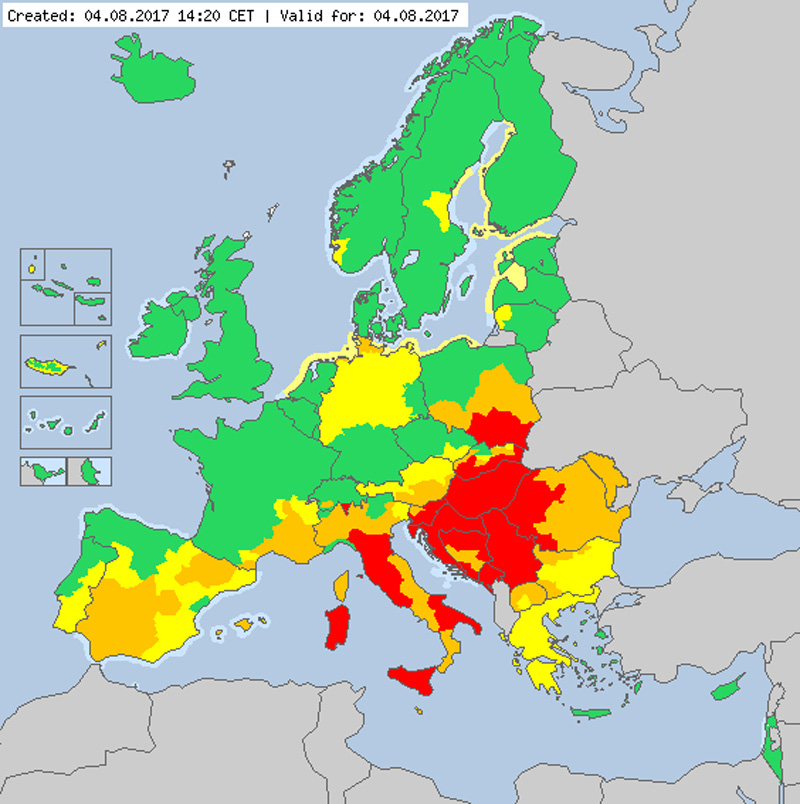
Meteoalarm, a Europe-wide weather warning system, based on warnings gathered from national weather services, issued its highest “red” alert, meaning that “exceptionally intense meteorological phenomena are forecast” to 11 countries in Southeast Europe (Figure 1).
Heat adaptation measures were applied in some countries, including traffic restrictions in some places and outdoor work being banned during the hottest period of the day.
This article gives an overview of the European summer temperature extremes on two time scales. We first look at three-day maximum temperatures and then summarise the meteorological summer season, June-August (JJA), for the Euro-Mediterranean region. We estimate the extremity of the events, how the likelihood of such events has changed, and the anthropogenic influence.
Methods
In this article we show the most remarkable aspects of the 2017 summer temperatures in the Euro-Mediterranean region. First we analyze observed temperatures and show how exceptional the summer was and assess whether or not there is a trend toward increasing temperature. We do this for two different time scales; three-day heat waves — including the event at the beginning of August dubbed Lucifer — and the summer season June-August (JJA) as a whole. This is complementary to our earlier June analysis.
To assess the role of climate change, we compare observations with results from climate models that are available and suitable for the temperatures in the Euro-Mediterranean region. This answers the question whether and to what extent external drivers, in particular human-caused climate change, can explain the positive three-day and summer 2017 temperature trends in the observational data. Including models allows us to give the causation of a trend. Models included in this analysis are EC-Earth 2.3, HadGem3-A, EURO-CORDEX, weather@home and CMIP5. A more detailed description of these models can be found in Section 6.
For both time scales we illustrate the event in the observations and set the event definition for analysis, including the region and the measure of temperature to be used. We also calculate how the probability of the event is changing over time, by fitting the temperature observations to a distribution that shifts proportional to the smoothed global mean temperature. The distribution is once shifted up to the climate of 2017 with the fitted trend and once shifted down to a past climate (1950 or 1900, depending on the length of the time series). This method assumes that global warming is the main factor affecting local temperatures on the 100-year time scale. The type of distribution that we use can be different for the different time scales. The change in the likelihood of the event occurring due to the change in climate (the Risk Ratio) is calculated from the fitted distributions for the current climate and a past climate.
Risk Ratios for the two time scales (three-day heat waves and summer) are also calculated for the models. Finally, we summarize all the results per time scale using the change in probability that has occurred relative to pre-industrial conditions, according to the trend in observations and model ensembles.
Heat waves
Area averaged results
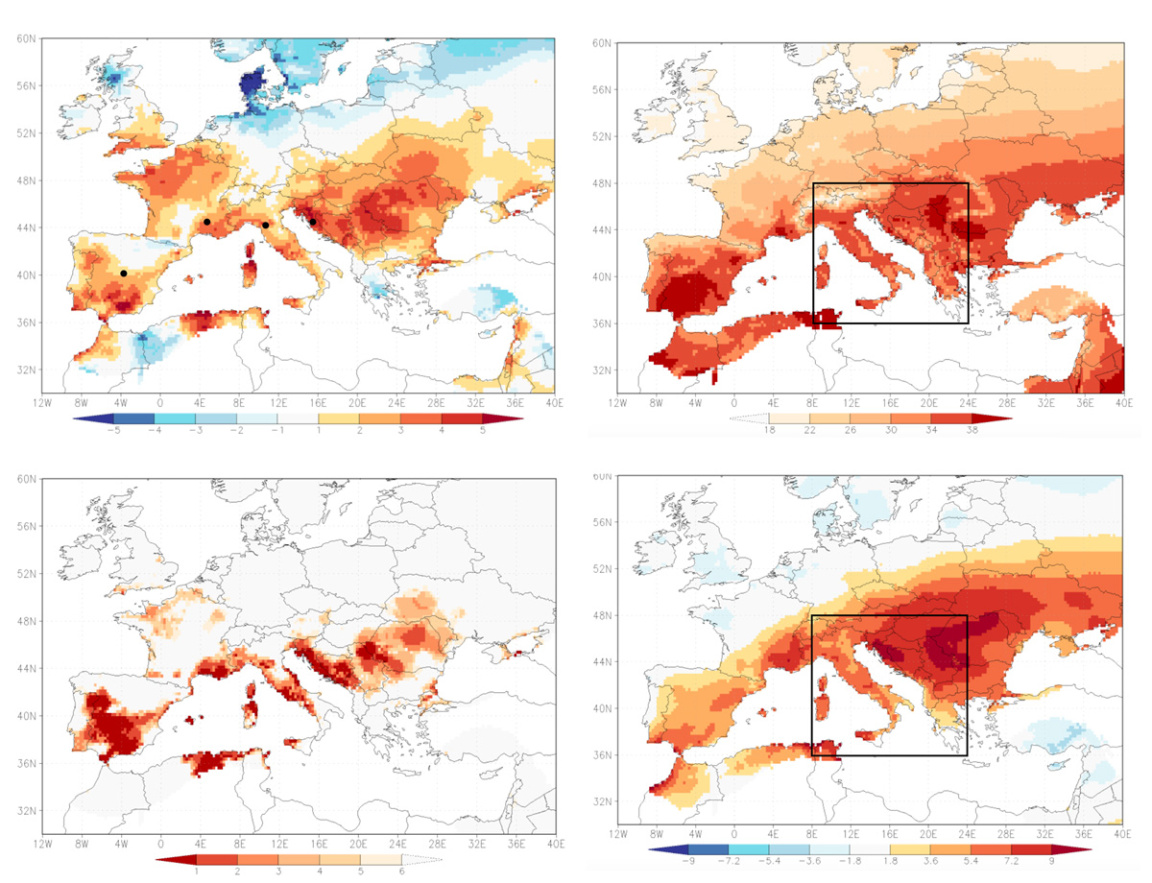
To analyze the heat wave event in Southeast Europe we use daily maximum land temperatures (Tmax) averaged over the box 8–24ºE, 36–48ºN, which we refer to as Southeast (SE) Europe, see Figure 2. This box corresponds fairly well to the region that experienced the most severe impacts in early August, according to country-based weather warnings issued by Meteoalarm (Figure 1). Whilst southern Poland was also issued an extreme heat warning, the station density in the underlying ECA&D dataset surrounding this region is much lower than the rest of the box and therefore we limit the northern boundary to 48ºN, just south of Poland.
In the resulting time series we investigate whether changes to the annual maxima of three-day maximum temperatures can be detected. The three-day time scale is a commonly used interval for assessing heat waves in Europe (in a large study of the impacts of heat waves on mortality, D’Ippoliti et al (2010) disregard one-day peaks in temperature and find that longer duration heat waves have more impact). The 2017 three-day Tmax peaks in the chosen box from August 3-5 with a value of 34.4°C. The annual maxima of three-day averaged Tmax for 2017, as well as the rank of this maximum and the three-day averaged Tmax for August 3-5, 2017 are shown in Figure 2.
The observational data set used for the areal analysis of SE Europe is the daily E-OBS analysis, which spans the period from January 1950 – August 2017. As this observational data set begins in 1950, all changes in risk and intensity of three-day heat waves in this section are given with respect to 1950. In the concluding section, we additionally give the change in risk with respect to the year 1900. The annual maxima of the area averaged temperature time series are described well by a GEV distribution, see Figure 3. The 2017 temperature value is the highest temperature in this time series, with a value of 34.4°C, which, compared to the years 1981-2010, is 3.4°C higher than the average annual maximum of three-day Tmax, and 7.1°C higher than normal for the time of year.
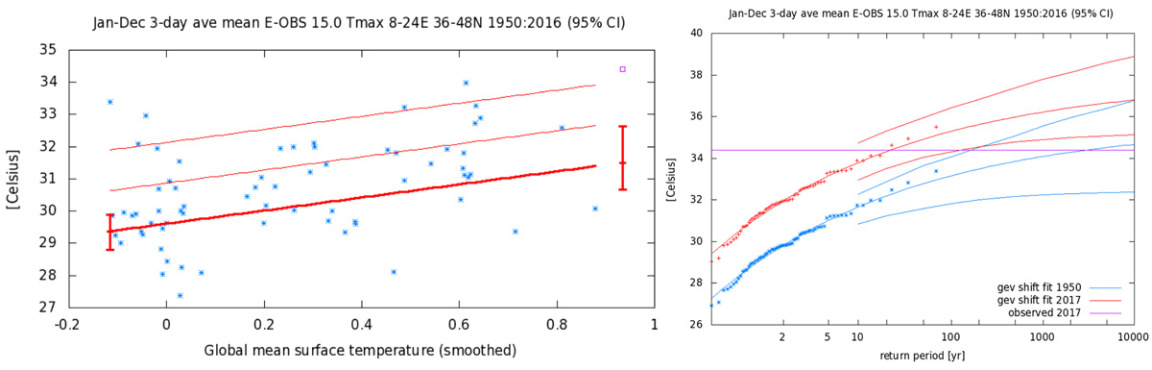
The area averaged return period in 2017 is about 20 years (95% Confidence Interval (CI): 7 – 130 years). This is equivalent to a 5% chance per year. The best estimate of the return period in 1950 is 3000 years, but in this case the return period depends on extrapolation of the fit and therefore depends strongly on the distribution that is assumed. The return period in 1950 is at least 160 years. The ratio of these return periods gives a best estimate of the risk ratio between 1950 and 2017 of 140 (95% CI at least 5), and a change in magnitude of about 2.1 °C (95% CI 0.9 – 3.7°C).
Model results — area averaged
For the three-day area averaged heat wave analysis, we did not use EC-Earth 2.3 or HadGEM3-A because the variability in these models is too large compared to observations. The fitted distributions from these models therefore differ too much from the distribution fitted to observations. The weather@home model also did not pass the validation tests for the three-day area averaged heat wave analysis.
For EURO-CORDEX, we pooled an ensemble of 11 bias-adjusted models to obtain return period statistics (see section 6 for the model description details). The climate of 2001-2030 (red) gives a return time for the 2017 event magnitude of around 20 years, see Figure 4. An event of this magnitude was above the distribution simulated for the recent climate 1971-2000. It is therefore clear that in this model hot events like this become more common, but as the distribution for 1971-2000 never reaches the 2017 observed value, it is not possible to give a value for the risk ratio.
The three-day event has not been studied in the CMIP5 ensemble for this study. However, CMIP5 has been used in a separate study of the same heat wave event using a single-day heat wave definition. There are some methodological differences, like the selection of the maximum temperature, and the extension of the study box slightly further to the north. Despite the differences we can still qualitatively compare the results, although we cannot include them in our synthesis. The conclusion on the single-day analysis is that the chance of extreme hot summer days, like the 2017 event, has increased by at least fourfold because of human-caused climate change. This aligns with our findings here that there is a strong increasing trend in hot three-day averaged maximum temperatures.
Synthesis — area averaged
Although we can not give a best estimate based on both observations and model analyses, it is clear that there is a positive trend in the occurrence of hot events like the heat wave in August 2017. Observations show that since 1950 the risk has at least quintupled, but is probably much higher.
Station data results
Outside of this region, southern Spain also experienced exceptionally high temperatures, however there the strongest heat wave was earlier, around July 13. To acknowledge single locations both within and beyond the study box with exceptional heat wave conditions, we additionally study several station data time series: Madrid in Spain, Montélimar in France, Monte Cimone in Italy and Gospić in Croatia. For station observations we use homogenised series based on the ECA&D dataset. Note that the first two stations were not record warm in 2017 in this measure. The record heat wave was more southerly in both Spain and France, but we could not find reliable non-coastal stations in that region.
For heat waves, station data are in general more reliable than analyzed data because the grid boxes may contain information from varying numbers of stations. This affects the variability, and if this is not constant we cannot do the extreme value analysis. However, station data is often also inhomogeneous due to station relocations or changes in the surroundings. We attempted to choose stations that have not been moved much. Inhomogeneities in the monthly mean have been detected and corrected for by comparison to other stations in a box of 3º×3º using quantile matching (Trewin, 2013). We did not consider coastal stations, even though these often have the strongest trend signals due to low variability, as the models often cannot simulate coastal conditions.
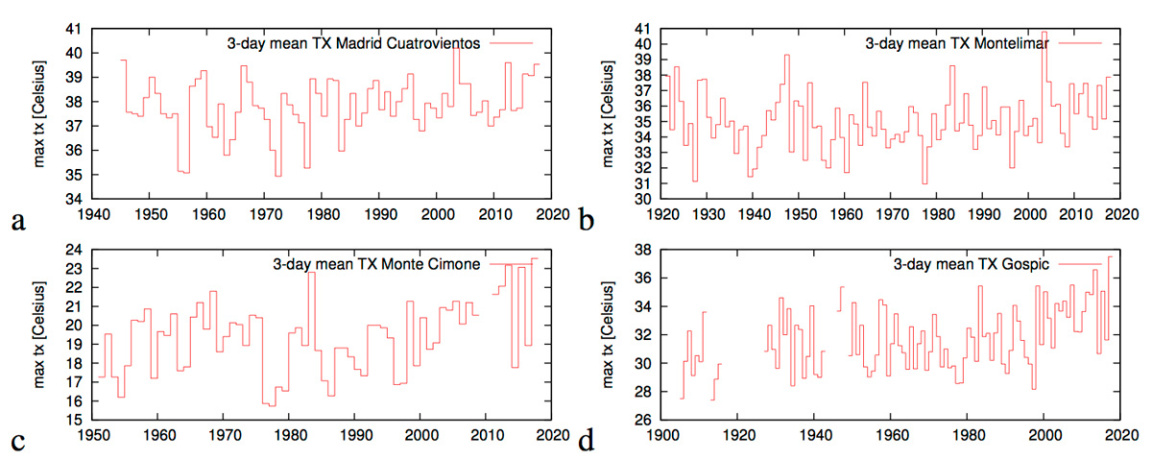
The station data are plotted in Figure 5 and the results are described below. A summary of the observed values and return periods is given in Table 1, and Table 2 summarizes the risk ratios and change in event magnitude.
Table 1. Observed value and return period of 2017 annual maxima of three-day Tmax.
| Station | Dates of three-day maxima in 2017 | Observed value and anomaly wrt 1981–2010 | Return period in current climate | 95% CI on return period |
|---|---|---|---|---|
| Spain: Madrid-Cuatro Vientos(1945-now) | July 12-14 | 39.5 ºC, 6.3 ºC | 6 yr | 3 … 19 yr |
| France: Montélimar(1921-2017) | August 2-4 | 37.9 ºC, 8.0 ºC | 6 yr | 3 … 20 yr |
| Italy: Monte Cimone(1951-2017 with gap) | August 3-5 | 23.5 ºC, 14.7 ºC | 20 yr | 6 … 500 yr |
| Croatia: Gospić(1906-2017 with gaps) | August 3-5 | 37.5 ºC, 10.4 ºC | 40 yr | 4 … ∞ yr |
In Spain we study the temperatures at Madrid-Cuatro Vientos Airport (1945-now, 40.38 ºN, 3.79 ºW, 687.0 m). The station in the park in the city center, Madrid Retiro, was record warm, but has a larger trend than surrounding stations, possibly related to changes in surroundings. In Madrid-Cuatro Vientos, the three-day heat wave around July 13 was a one in six year event (3 to 19 yr). This is about 13 times more likely than around 1950 (2 to 1300), an increase in temperature of about 1.1 ºC (0.3 to 2.1 ºC).
In southeast France and Corsica, maximum temperature records were set in Montpellier and Ajaccio. The observations also show very clear trends over the weather variability. However, as these are coastal stations we cannot expect models to simulate the local climate. We therefore use an inland station, Montélimar (1921-2017, 44.58 ºN, 4.73 ºE, 73.0 m), although the heat wave in early August was not the warmest on record there and the variability larger compared to the trend. At this station, there is a positive trend in the warm extremes, although it can only just be detected above the natural variability (p~0.02). The return time of the 2017 heat wave was about one in six years (3 to 20). This is about three times (1.1 to 10) more likely than around 1950.
In the part of Italy affected by the heat wave, trends in ECA&D station data vary from slightly negative to very strongly positive. As far as we know, no attempt has been made to homogenise this data yet. The station on the summit of Monte Cimone (ECA 2082, 44.20 ºN, 10.70 ºE, 2165.0 m) does not have inhomogeneities that are visible by eye and likely measures the climate trend as the station is located in an open and undeveloped area, except for underground military installations. It observed the highest three-day Tmax in the record since 1951 in 2017. A fit to these annual extremes shows that the return period of having a three-day period with Tmax as high as observed in 2017 or higher is 20 yr (6 to 500 yr) in the current climate. This is a factor 200 (larger than 2) higher than around 1950. The temperature of these extremes has increased by about 2.1 ºC (0.3 to 3.8 ºC). The large uncertainties are due to the short record.
In Croatia we analyze the observations at Gospić (44.55 ºN, 15.37 ºE, 564.0 m). The homogenised series has data starting in 1905, but with gaps 1916 to 1926, Nov 1942 to Feb 1945 and 1948. Here also the three-day heat in 2017 was the most severe on record, with a return period in the current climate of 40 yr (>4 yr). This is a factor 60 (larger than 4) higher than around 1950. The temperature of these extremes has increased by about 2.6 ºC (1.2 to 3.8 ºC).
Table 2. Risk ratios and ∆T at stations/nearest model grid point for annual maxima of three-day Tmax.
| Data set | Year of comparison (for p0) | Risk Ratio (p1/p0) | 95% CI on RR | ∆T, change in magnitude | 95% CI on ∆T |
|---|---|---|---|---|---|
| Spain: Madrid-Cuatro Vientos Airport, 40.38 ºN, 3.79 ºW, 687.0 m | |||||
| Station Madrid-Cuatro Vientos(1945-now)1950132 … 13001.10.3 … 2.1 | |||||
| EURO-CORDEX | 1971-2000 | 5 | 3 … 7 | 1.1 | 1.0 … 1.2 |
| France: Montélimar, 44.58 ºN, 4.73 ºE, 73.0m | |||||
| Station Montélimar(1921-2017) | 1950 | 3.3 | 1.1 … 9.5 | 1.5 | 0.1 … 2.7 |
| EC-Earth | 1950 | 4.9 | 3.8 … 6.3 | 2.0 | 1.8 … 2.3 |
| EURO-CORDEX | 1971-2000 | 4.2 | 2.5 … 5.8 | 1.7 | 1.6 … 1.8 |
| Italy: Monte Cimone, 44.20 ºN, 10.70 ºE, 2165.0m | |||||
| Station Monte Cimone(1951-2017) | 1950 | 220 | 1.9 … ∞ | 2.1 | 0.3 … 3.8 |
| EC-Earth | 1950 | 4.7 | 3.6 … 5.8 | 2.0 | 1.7 … 2.3 |
| EURO-CORDEX | 1971-2000 | 3.5 | 2.5 … 7.5 | 1.5 | 1.1 … 2.3 |
| Croatia: Gospić, 44.55 ºN, 15.37 ºE, 564.0m | |||||
| Station Gospić(1906-2017) | 1950 | 60 | 4 … ∞ | 2.6 | 1.2 … 3.8 |
| EC-Earth | 1950 | 4.4 | 3.3 … 5.4 | 1.7 | 1.6 … 1.9 |
Model results — station locations
For the three-day averaged heat wave analysis at station locations we did not use HadGEM3-A or weather@home. For HadGEM3-A at all four station locations the scale parameter was not compatible with the fit to the observations. The trend was also much higher. In weather@home the variability was too high.
EC — Earth model
For individual stations, the larger model variability often fell within the uncertainty range of the observations, so we could use them (with caution). The EC-Earth simulations for the grid point nearest to Madrid were not used as the scale parameter is a factor two larger in the fit to model data than to observations.
For the grid point closest to Montélimar, all fit parameters are within the 95% uncertainties of the corresponding ones from the fit to the observations except the mean: the model is too cold. With a 6.5 ºC bias correction to the mean we obtain a risk ratio ~ 4.9 (3.8 to 6.3), ∆T ~ 2.0 ºC (1.8 to 2.3 ºC).
The grid point closest to Monte Cimone is much lower than the actual mountain, so the model is warmer by 10.8 ºC. The scale parameter is 20% larger, which is just outside the 95% CI of the observations. The shape parameter and trend are compatible to the observations. The risk ratio is 4.7 (3.6 to 5.8), ∆T ~ 2.0 ºC (1.7 to 2.3 ºC).
The EC-Earth simulation for the grid point nearest to Gospić is again too cold (5.6 ºC), but scale, shape and trend parameters agree with the observed ones within their 95% uncertainty intervals. We find a Risk Ratio of 4.4 (3.3 to 5.4), corresponding to an increase in temperature of 1.7 ºC (1.6 to 1.9 ºC).
EURO-CORDEX model
The EURO-CORDEX ensemble was used for only three of the four stations as temperatures for Gospić were found too low compared to observations (an event with 37.5°C was above the current climate distribution, with a return period higher than 100 years). For Madrid, a closer agreement was found and a risk ratio (defined between the periods 1971-2000 and 2001-2030) of about 5 was found. For Montélimar, similar results were found with a risk ratio of 4.2. For Monte Cimone, the temperature was above the observation for the same return period, most probably due to an elevation issue. A risk ratio of 3.5 was found. Temperature differences of 1 to 2 °C between the two periods were consistently found in each case.
Synthesis — station locations
For the station locations, we now conclude on risk ratios based on the station data and the available model results, being one or two models per station location. This provides estimates of the lower and upper bounds (95% CI) of the risk ratio between 1950 and 2017.
In Spain, at Madrid-Cuatro Vientos Airport, we estimate the risk ratio to be between 6 and 50. At this location the EURO-CORDEX model confirms the risk ratio seen in observations and confines the uncertainty range.
In France, in Montélimar, the range in risk ratio of both the EC-Earth model and the EURO-CORDEX model align well with observations. This gives a risk ratio of between 3 and 8.
In Italy, in Monte Cimone, the risk ratio is at least 3.5. The models EC-Earth and EURO-CORDEX indicate an upper bound of 8.
In Croatia, in Gospić, the risk ratio is also at least 3.0. The EC-Earth model indicates an upper bound of 7.
In general, observations and models agree on a trend toward higher three-day summer temperature extremes like the event in summer 2017, at the selected individual station locations. Probabilities in 2017 are at least three-fold compared to 1950.
Summer (JJA) maximum temperature
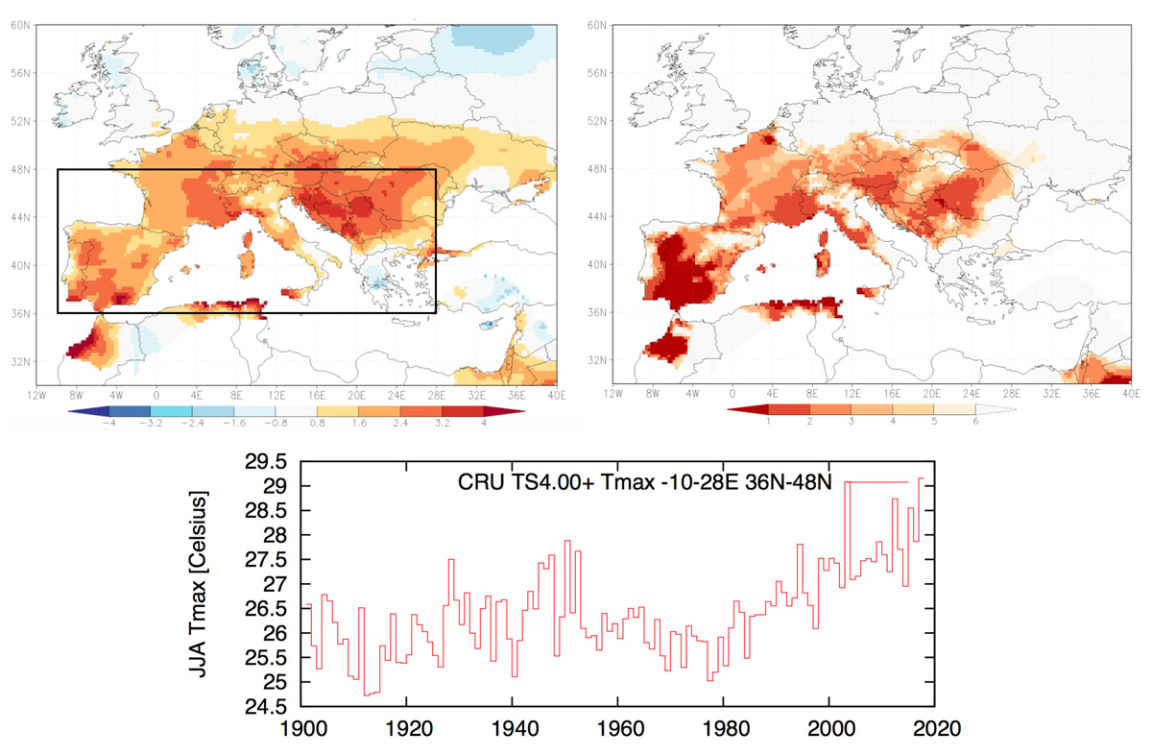
To analyde the hot summer in Southern Europe we use daily maximum land temperatures averaged over the box 10 ºW–28 ºE, 36–48 ºN, which from now on we refer to as the Euro-Mediterranean region, see Figure 6. The Euro-Mediterranean box has the same latitudinal extent as the SE Europe box for the same reasons, but extends further to the east and west to include Southern France, the Iberian Peninsula and the eastern Balkans, which also experienced an anomalously warm summer. It also includes a small part of northern Africa that was anomalously hot. The area-averaged data is averaged over the months June–August to give the summer-mean maximum temperatures.
For observations we use the monthly CRU-TS 4.00 dataset, which has data from 1901 to 2015, extended with adjusted values for 2016 and 2017 from the monthly E-OBS dataset. We refer to the extended data set as CRU-TS 4.00-ext. In this dataset the summer of 2017 was the warmest on record averaged over this box. It should be noted that in the E-OBS dataset it was the second-warmest, after 2003. We use the CRU TS 4.0 dataset as it is designed more for seasonal time scales, whereas E-OBS was optimized for daily time scales.
The Euro-Mediterranean temperature time series is described well by a GPD distribution, see Figure 7. The JJA averaged maximum temperature reached a value of 29.2 °C, which is 2.2 °C above the 1981-2010 average.
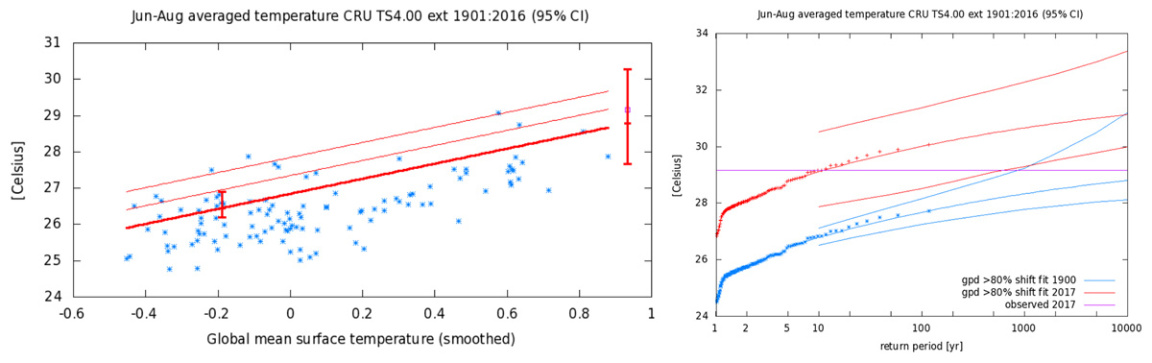
The return period of Euro-Mediterranean temperature in 2017 is around 10 years (95% CI: 1.8… 620). This is equivalent to a 10% chance per year. As for the three-day analysis, the return period in 1900 requires extrapolation of the fit and therefore depends strongly on the distribution that is assumed. The best estimate of the return period in the early 1900s is roughly once in 2,000 years, the lower bound is roughly once in 900 years. This gives a an increase in probability (risk ratio) of very roughly 10,000, again strongly dependent on the extrapolation and hence very uncertain (95% CI: > 5). This means the odds of seeing a summer this hot at least quintupled (i.e., became at least 5 times more likely).
Model results
EC-Earth Model ensemble
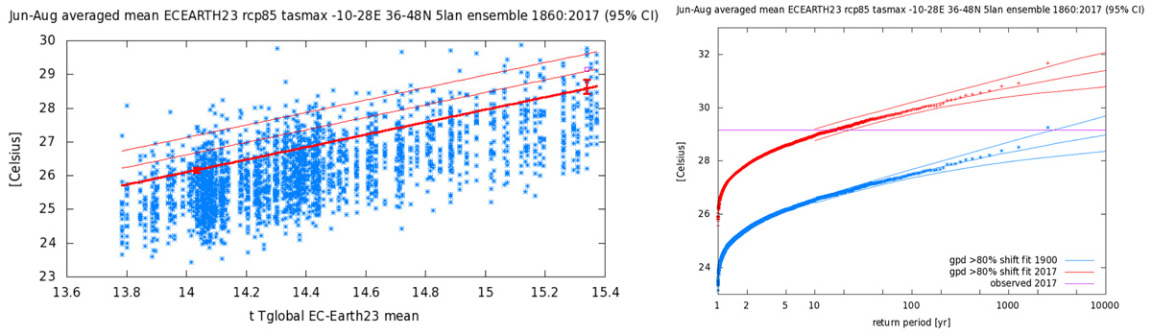
The EC-Earth ensemble performs well against observations for the Euro-Mediterranean region (see Figure 8). Summers similar to June-August 2017 are found to occur with increasing frequency, with a risk ratio of 1900 (95% CI at least 160) between now and the beginning of the century. The temperature of summers as anomalous as 2017 have increased by 2.4°C (95% CI: 2.2 to 2.8°C) between 1900 and now. By the time the model’s global mean surface temperature has increased by 2 °C with respect to the pre-industrial period under the assumption of the RCP8.5 scenario, the JJA 2017 observed maximum temperatures occur about every three years (95% CI: 2.2 to 3.6 years) and hot summers have become about 1 °C warmer. By the end of the century, under the assumption of the RCP8.5 scenario, all ensemble members produce summers warmer than 2017. This implies that the JJA 2017 temperatures will be far below normal in that climate (by about 6 °C).
HadGEM3- A model ensemble
The HadGem3-A historical ensemble shows a strong trend towards more hot summers. However, the runs that are done under natural conditions, the historicalNat ensemble, also show a positive trend, although less strong. So even though the resulting trend is still toward more hot summers, it is very hard to estimate the resulting risk ratio for the HadGem3-A model. The model thus qualitatively agrees with observations, but it will not be included in the synthesis.
EURO-CORDEX multi-model ensemble
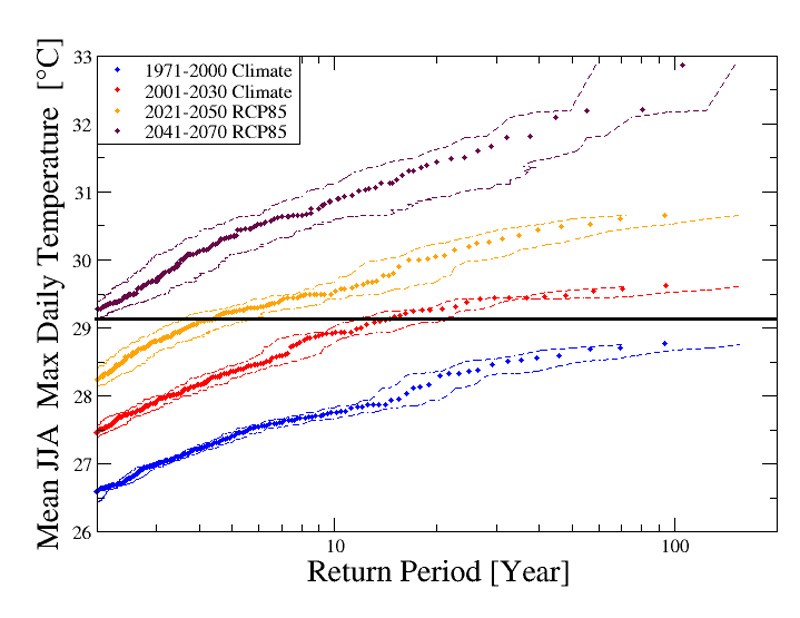
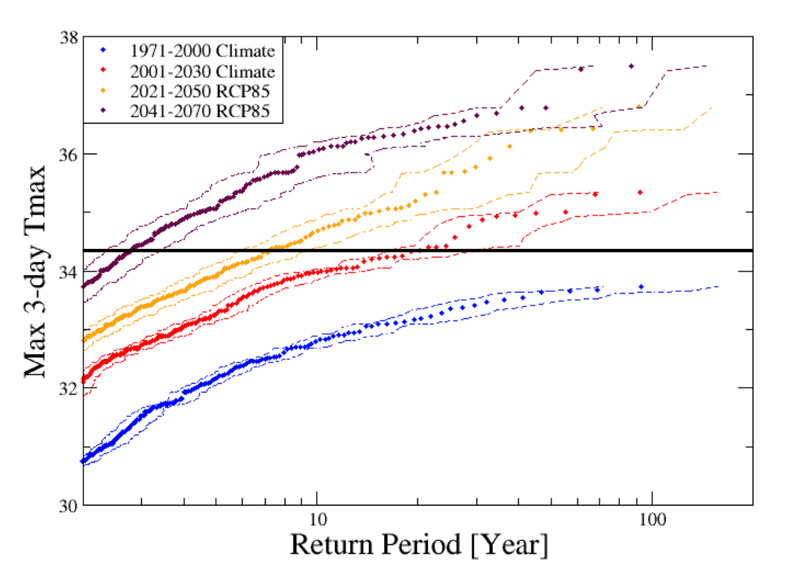
In the EURO-CORDEX ensemble, a summer with maximum temperatures such as witnessed in 2017 over the Euro-Mediterranean region was found to occur on average every 10 to 20 years (Figure 9). In the simulated climate of the end of the 20th century (1971-2000), such an event had a return period larger than 1000 years and the risk ratio was very large (>10). If climate follows the RCP8.5 scenario, a similar event could occur on average every four years between 2021 and 2050 and about every other year in the middle of the century (2041-2070).
weather@home model ensemble
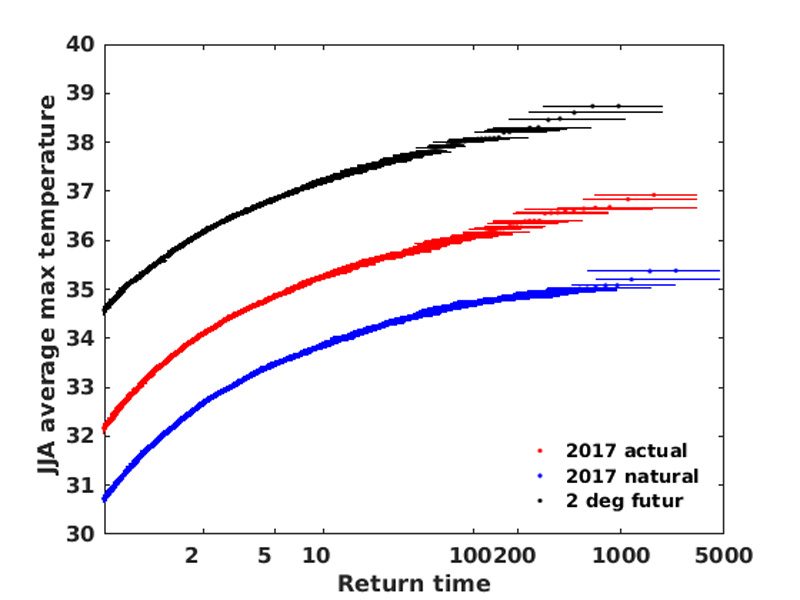
Different from the three-day analysis, the distribution and variability for the JJA time scale in the weather@home model in the model climatology compare well with observations. In the weather@home ensemble the risk ratio between pre-industrial and now for an event with a return period of about 10 years is 120 (95% CI 65 – 470, see Figure 10). Including future runs indicates that what is a 1 in 10 year event in 2017 will be a 1 in 1.2 year event under a 2° C scenario, i.e., occurring almost every year. The curves are similar to each other in shape shifted up or down, supporting the assumption of a shift made in the observational and EC-Earth analyses.
CMIP5 multi-model ensemble
CMIP5 analysis was only performed for the JJA period over the Euro-Mediterranean domain. Temperature anomalies from a 1961-1990 climatology were calculated in both the observational series and the model simulations (relative to that period in the historical runs).
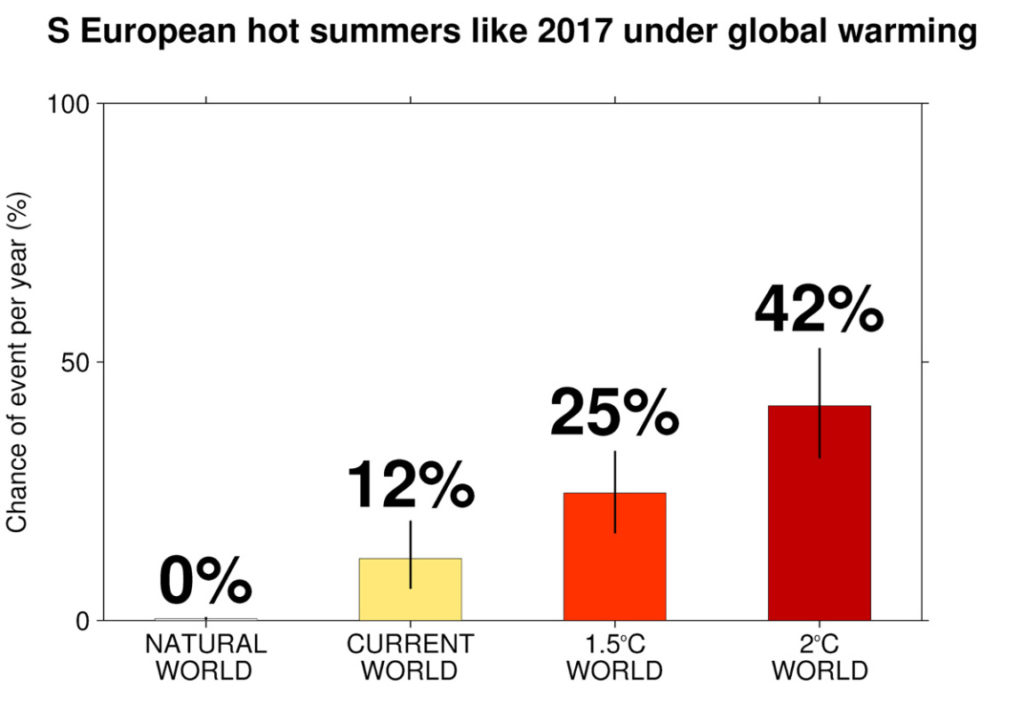
The attribution analysis was conducted on the 2017 value (+3.14°C above the 1961–1990 climatology).
The likelihood of hot summers exceeding the 2017 threshold is compared for the natural world simulations (histNat; 1901-2005) and the current world (RCP8.5; 2006-2026). To estimate the change in likelihood, and associated confidence intervals, the pairs of complete CMIP5 simulations are 50% bootstrap resampled 10000 times, and the change in likelihood of extreme heat is recalculated. The anthropogenic influence on the intensity of the heat was also estimated through a similar bootstrapping method on the 99th percentile temperature change between the natural world and current world. The analysis shows a significant warming trend with a best estimate in risk ratio between pre-industrial and now of 35, see Table 3.
This process is repeated for the 1.5°C and 2°C global warming worlds (see King et al. 2017 for details). The result shows a continuing trend towards more warm summers and is presented in Figure 11.
Synthesis summer (JJA) maximum temperature
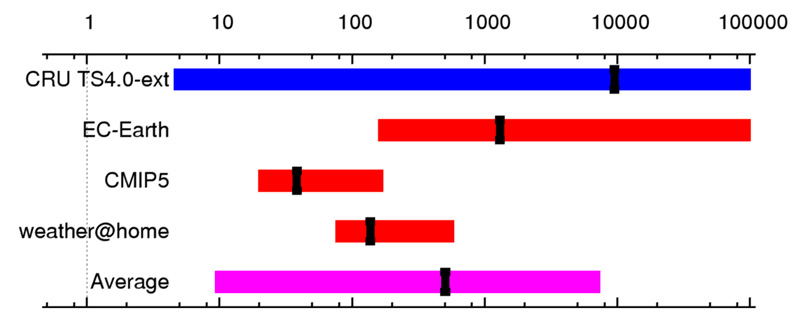
Table 3 summarises all results on the change in probability for observed and modelled area averaged temperature extremes over JJA as well as the change in magnitude. Figure 12 summarises the change in probability, with respect to the year 1900, graphically. Both the observations and models show that the likelihood of hot summers has increased significantly (all risk ratios and their confidence intervals are well above 1). We computed an unweighted average of all results, but excluding the EURO-CORDEX number as the very large risk ratio in this model could not be estimated. The best estimate for the factor change in probability is about 500, with a lowest estimate of 10. This estimate is conservative due to the large uncertainty in observations, the shape of the distributions and the fact that the average is unweighted. An unweighted average does not account for model spread in addition to natural variability. Weighting the results by the magnitude of uncertainty leads to a higher estimate. As is typical for extreme temperature distributions, there is a negative shape parameter here, as also for the June study, implying that the distribution has negative curvature and becomes flatter the further into the tail. The return times thus become more sensitive to the threshold temperature used, which contributes to large uncertainties around the best estimates, especially when the sample size is small.
Table 3. Risk Ratios for observed and modeled area averaged trends over JJA and corresponding change in magnitude.
| Dataset | Risk Ratio w.r.t. year | Risk Ratio (p<1/p0) | 95% CI on RR | ∆T, change in magnitude | 95% CI on ∆T |
|---|---|---|---|---|---|
| CRU-TS4.00-ext | 1900 | 9500 | 5… ∞ | 2.3 °C | 0.8… 3.7 °C |
| EC-Earth | 1900 | 1300 | 160… ∞ | 2.4 °C | 2.2… 2.8 °C |
| EURO-CORDEX | NAN | >10 | |||
| weather@home | pre-industr. | 120 | 65…470 | ||
| CMIP5 | pre-industr. | 35 | 20…140 | 1.8 °C | 1.4…2.4 °C |
Conclusions
Summer (June–August) 2017 was generally very hot in Western and Southern Europe, with local and area-averaged records broken, and much of Mediterranean Europe ranking in the top three summers since 1950. In Portugal, Spain, and the Netherlands it was the hottest June ever recorded. In addition to mean temperatures, monthly averaged maximum temperatures averaged over Portugal and Spain also broke the records, being about 4°C above normal (1981-2010). Later this summer an even hotter heat wave around July 13 occurred in Spain. In a region from Southern France to the Balkans a remarkable heat wave also contributed to the anomalous summer, with three-day maximum temperatures peaking over August 3-5 at 34.4 °C (7.1 °C above average for the time of year) according to the E-OBS data set, breaking the area-average record in this region (8–24ºE, 36–48ºN) since 1950.
In this study we analyzed the magnitude and return period of 2017’s summer season maximum temperatures in the Euro-Mediterranean region (10ºW – 38ºE, 36 – 48ºN) using the CRU-TS 4.00 data set extended with E-OBS. The 2017 JJA maximum temperatures were more than 2°C above the 1981-2010 average and had a return period of only about 10 years (1.8 to 620) in the current climate. This is much more frequent than it used to be. Models and observations agree that there is an upward trend in the odds of warm summers, although there is a wide spread in the risk ratios, with best estimates spanning orders of magnitude and a lower bound of 10 with respect to the year 1900.
The model results indicate that past historical increases in greenhouse gases have raised the odds of a warm summer in the Euro-Mediterranean box considerably. The observed trend is compatible with the effects of human-induced emissions of greenhouse gases. Examining model simulations for future scenarios (weather@home, CMIP5, EURO-CORDEX) and model simulations that extend into the future (EC-Earth), we can also conclude that Euro-Mediterranean summer seasons, such as that experienced in 2017, will become the norm by the middle of the century.
We additionally analysed the August heat wave in Southeast Europe using observations (E-OBS) and model data averaged over the region 8–24ºE, 36–48ºN and at station locations. The observed 2017 return periods are around 20 years (box average) and span 6-40 years for 4 individual stations in Spain, France, Italy and Croatia. Observations give best estimates for risk ratios (with respect to 1950) of around 140 for the box average, and at least a factor of 5. Extrapolation of these risk ratios to obtain values with respect to the year 1900 gives around 200 for the box average, and at least a factor 5. The EURO-CORDEX models agree on a positive trends toward more hot temperatures like the three-day heat wave in 2017, but other models cannot reproduce key features of the distribution of heat waves.
For the station locations analyses from station data also agree on a positive trend towards more hot extremes. Combining model analyses and observational analyses gives risk ratios between 1950 and 2017 at the four station locations of at least 3.0 with respect to 1950 (and at least 3.5 with respect to 1900) but most likely much higher. Considering both the box-average and the station location results, we estimate the increase in risk for similar heat waves in SE Europe to be at least 4-fold.
In conclusion our analysis finds that on several time scales (three-day, June and summer) there is a positive trend in hot temperature extremes. A hot summer or heat wave as observed last summer would have been very rare a century ago, but is already fairly common today, with about 10% chance every year. By the middle of the century this will be normal weather.
Model descriptions
For the analysis of the European summer of 2017 we looked at five different climate models and modelling initiatives respectively (weather@home, HadGEM3-A, EC-Earth 2.3, CMIP5 and EURO-CORDEX). CMIP5 is a collection of coordinated experiments from climate models run at centers across the world and is used in the IPCC Fifth Assessment Report. The EC-Earth 2.3 model, which also forms part of the CMIP5 ensemble, was run 16 times at KNMI, with small differences in atmospheric initial conditions. The CORDEX ensemble of Regional Climate Model (RCM) runs downscales CMIP5 runs from 1950-2100 to much higher resolutions over Europe (11km). 11 bias-adjusted ensemble members of the European CORDEX branch EURO-CORDEX (www.euro-cordex.net) are used in this analysis. Two further ensembles of atmosphere-only models are used: the UK Met Office HadGEM3-A model at N219 (60km) and the very large ensemble of Oxford’s weather@home runs of HadRM3P simulations at (50km). These models are all run with and without (the “counterfactual”) human-caused emissions of greenhouse gases and aerosols, allowing us to isolate and quantify the influence of human-induced climate change on the likelihood of June warm spells within the climate models. The models are described in more detail below.
CMIP5
The CMIP5 ensemble, the “5th Coupled Model Intercomparison Project” ensemble (Taylor et al. 2012), consists of fifteen coupled global climate models with all required model data available for the ‘tas’ variable. The fifteen CMIP5 models were evaluated against the E-OBS dataset using a Kolmogorov-Smirnov test. Models where at least two-thirds of historical simulations were not statistically dissimilar (i.e. p>0.05) to the observed series for the common 1950-2005 period were used in further analysis. Fourteen models passed this test and were used in the analysis, and one model failed.
weather@home
Using the distributed computing framework known as weather@home (Massey et al. 2015), we simulate three different large ensembles of summer 2017 using the Met Office Hadley Centre regional climate model HadRM3P at 50km resolution over Europe embedded in the atmosphere-only global circulation model HadAM3P. The first set of ensembles represents possible June weather under current climate conditions. This ensemble is called the “all forcings” scenario and includes human-caused climate change. The second set of ensembles represents possible summer weather in a world as it might have been without anthropogenic climate drivers. This ensemble is called the “natural” or “counterfactual” scenario (Schaller et al., 2016). The third set of ensembles represents a future scenario in which the global mean surface temperature is 2°C higher. To simulate this third scenario we use atmospheric forcing ancillaries derived from RCP2.6 and 4.5 and sea surface temperatures that match the atmospheric forcing obtained from CMIP5 simulations (Mitchell et al., 2017).
HadGEM3-A
The 15 HadGEM3-A atmosphere-only runs from 1960–2015 (Ciavarella et al, 2017) (N216, about 60km) are evaluated for the separate regions. The model is driven by observed forcings and sea-surface temperatures (SSTs) (“historical”) and with preindustrial forcings and SSTs from which the effect of climate change has been subtracted (“historicalNat”). The latter change has been estimated from the Coupled Model Intercomparison Project phase 5 (CMIP5) ensemble of coupled climate simulations.
EC-Earth 2.3
EC-Earth 2.3 is a coupled atmosphere-ocean general circulation model ensemble with 16 members (Hazeleger et al. 2010), each producing a transient climate simulation from 1860 to 2100. The model resolution is T159 which translates to around 150 km in the European domain. The underlying scenarios are the historical CMIP5 protocols until the year 2005 and the RCP8.5 scenario (Taylor et al. 2012) from 2006 onwards. Up to about 2030, the historical and RCP8.5 temperature evolution is very similar.
EURO-CORDEX
We used an ensemble of 11 regional climate models simulating climate evolution over Europe with a high (12 km) resolution in order to estimate the changes in the odds of the event between the late 20th century and the current climate. The EURO-CORDEX simulations were bias-adjusted using the CDFt Method (Vrac et al. 2016) to obtain nonparametric return period statistics, using as reference data the WATCH Forcing Data ERA-Interim (WFDEI) dataset. These simulations account for a change in greenhouse gases but not aerosols (except the ARPEGE simulations). Four different EURO-CORDEX ensemble simulations have been run: 1971-2000 for the past climate (~1985) , 2001-2030 for the current climate (~2015), 2021-2050 for a near future climate (~2035) and 2041-2070 for a climate in the middle of the current century (~2055).
References
Ciavarella, A., Christidis, N., Andrews, M., Groenendijk, M., Rostron, J., Elkington, M., Burke, C., Lott, F.C., Stott, P.A. (2018) Upgrade of the HadGEM3-A based attribution system to high resolution and a new validation framework for probabilistic event attribution. Weather and Climate Extremes, 20 June 2018: 9–32. doi: 10.1016/j.wace.2018.03.003
D’Ippoliti, D., P. Michelozzi, C. Marino, de’Donato, F., Menne, B., Katsouyanni, K., Kirchmayer, U., Analitis, A., Medina-Ramón, M., Anna Paldy, A., Atkinson R., Kovats, S., Bisanti, L., Schneider, A., Lefranc, A., Iñiguez, C. and Perucci, C.A. (2010) The impact of heat waves on mortality in 9 European cities: Results from the EuroHEAT project. Environmental Health, 9: 37. doi: 10.1186/1476-069X-9-37
Hazeleger, W., C. Severijns, T. Semmler, S. Ştefănescu, S. Yang, X. Wang, K. Wyser, E. Dutra, J.M. Baldasano, R. Bintanja, P. Bougeault, R. Caballero, A.M. Ekman, J.H. Christensen, B. van den Hurk, P. Jimenez, C. Jones, P. Kållberg, T. Koenigk, R. McGrath, P. Miranda, T. Van Noije, T. Palmer, J.A. Parodi, T. Schmith, F. Selten, T. Storelvmo, A. Sterl, H. Tapamo, M. Vancoppenolle, P. Viterbo, and U. Willén. (2010) EC-Earth: A seamless Earth-system prediction approach in action. Bulletin of the American Meteorological Society, 91: 1357–1363. doi: 10.1175/2010BAMS2877.1
Lewis, S. C., and D. J. Karoly. (2013) Anthropogenic contributions to Australia’s record summer temperatures of 2013. Geophysical Research Letters, 40: 3705–3709. doi: 10.1002/grl.50673
King, A. D., D. J. Karoly, and B. J. Henley. (2017) Australian climate extremes at 1.5 and 2 degrees of global warming. Nature Climate Change, 7, 412–416. doi: 10.1038/nclimate3296
Massey, N., Jones, R., Otto, F. E. L., Aina, T., Wilson, S., Murphy, J. M., Hassell, D., Yamazaki, Y. H. and Allen, M. R. (2015) weather@home— development and validation of a very large ensemble modelling system for probabilistic event attribution. Quarterly Journal of the Royal Meteorological Society, 141: 1528–1545. doi: 10.1002/qj.2455
Mitchell, D., AchutaRao, K., Allen, M., Bethke, I., Beyerle, U., Ciavarella, A., Forster, P. M., Fuglestvedt, J., Gillett, N., Haustein, K., Ingram, W., Iversen, T., Kharin, V., Klingaman, N., Massey, N., Fischer, E., Schleussner, C.-F., Scinocca, J., Seland, Ø., Shiogama, H., Shuckburgh, E., Sparrow, S., Stone, D., Uhe, P., Wallom, D., Wehner, M., and Zaaboul, R. (2017) Half a degree additional warming, prognosis and projected impacts (HAPPI): background and experimental design. Geoscientific Model Development, 10: 571-583, doi: 10.5194/gmd-10-571-2017.
Schaller, N., Kay, A.L., Lamb, R., Massey, N.R., van Oldenborgh, G.J., Otto, F.E.L., Sparrow, S.N., Vautard, R., Yiou, P., Bowery, A., Crooks, S.M., Huntingford, C., Ingram, W.J., Jones, R.G., Legg, T., Miller, J., Skeggs, J., Wallom, D., Weisheimer, A., Wilson, S. and Allen, M.R. (2016) The human influence on climate in the winter 2013/2014 floods in southern England. Nature Climate Change, 6, pages 627–634. doi: 10.1038/nclimate2927
Taylor, K. E., R. J. Stouffer, and G. A. Meehl. (2012) An overview of CMIP5 and the experiment 962 design. Bulletin of the American Meteorological Society, 93: 485–498. doi: 10.1175/BAMS-D-11-00094.1
Trewin, B. (2013) A daily homogenized temperature data set for Australia. International Journal of Climatology, 33: 1510–1529. doi: 10.1002/joc.3530
Vrac, M., T. Noël, and R. Vautard. (2016) Bias correction of precipitation through Singularity Stochastic Removal: Because occurrences matter. Journal of Geophysical Research: Atmospheres, 121: 5237–5258. doi:10.1002/2015JD024511


