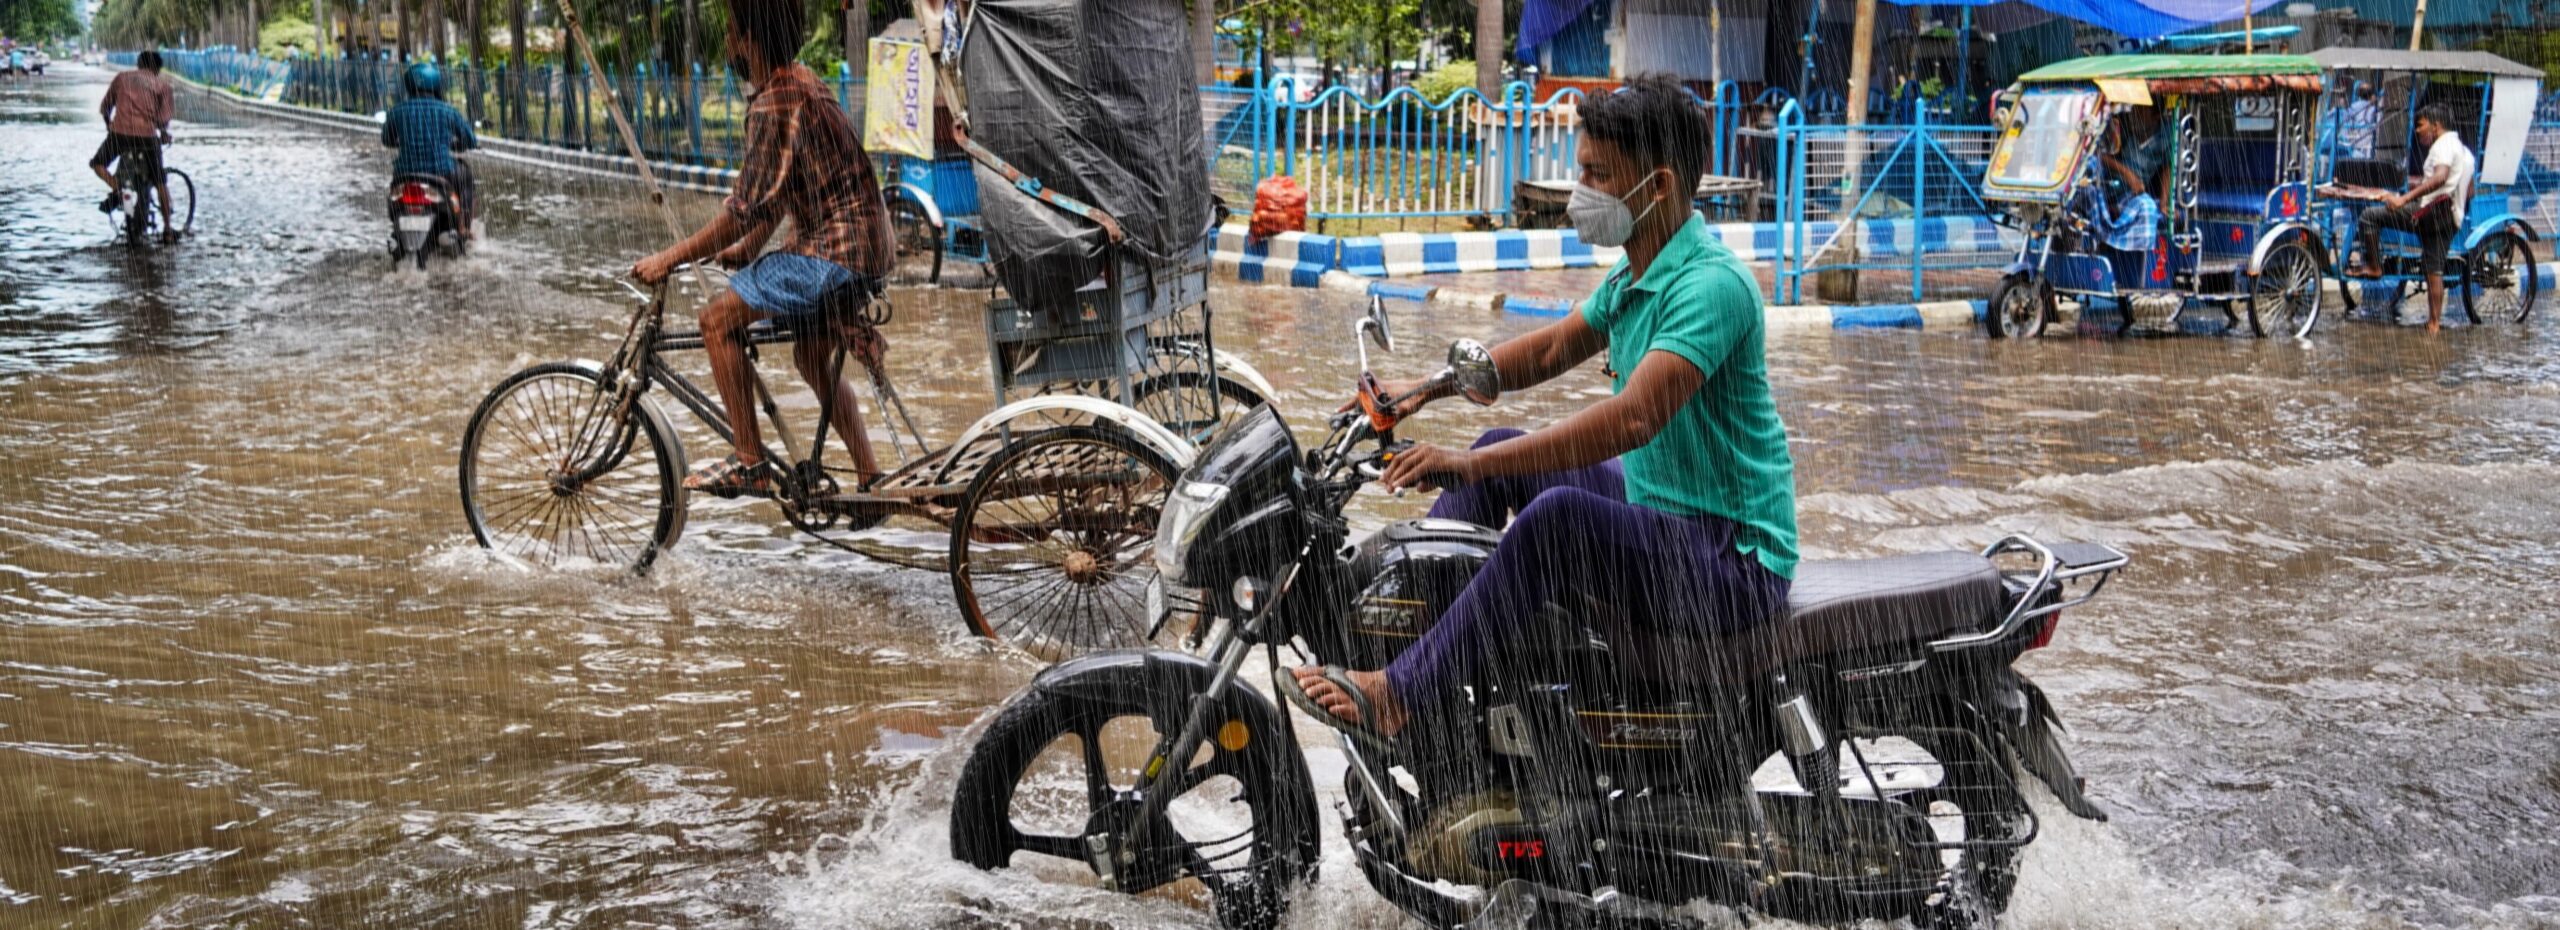
The torrential rain collapsed roads and bridges, and halted air and train travel in and out of the city, stranding hundreds of passengers.
A relentless downpour pounded Tamil Nadu’s capital city of Chennai on December 1, 2015, flooding and submerging one of India’s largest cities. The heaviest one-day rainfall in the region in more than a century – as much as 494 mm (19.45 inches) left more than three million people without basic services, collapsed roads and bridges, and halted air and train travel in and out of the city, stranding hundreds of passengers. “Chennai has become a small island,” said India Home Minister Rajnath Singh.
The catastrophic rains not only isolated the city, but forced tens of thousands from their homes. The military dropped food supplies to residents stranded on rooftops. For the first time in its 137-year history, the local paper went unpublished because staff could not reach the press. On December 2, authorities declared Chennai a disaster zone.
Costs to India’s economy due to the floodwaters in Chennai are estimated at US $3 billion.
Event
Standard daily rainfall observations in Chennai from 8:30 in the morning local time on December 1 to 8:30 in the morning December 2 showed 24-hour sums on average of 286 mm (11.26 inches), with some stations recording as little as 77 mm (3.03 inches) and as others as much as 494 mm (19.45 inches). The area’s main rainy season occurs from October through December during the northeast monsoon. That’s when high sea surface temperature (SST) in the Bay of Bengal, coupled with weak vertical wind shear conditions (wind shear is the change of wind speed and direction with height), make circumstances ideal for the cyclones, tropical storms and other rain storms that landfall on the coast of southeastern India.

The 2015 rainy season coincided with a strong El Niño, record warm global surface temperatures, and high Indian Ocean temperatures. The question is which, if any, of these factors influenced the probability of extreme rainfall in Chennai. Overall, SSTs in the Bay of Bengal – while higher than the observed trend – were still lower than elsewhere in the Indian Ocean during the 2015 rainy season. SSTs in the northern and western Bay of Bengal have increased very little during the past 35 years compared to observed global warming trends. This is likely due to increased air pollution in the region, the ‘brown cloud’ that blocks sunlight. That in turn counteracts the large-scale warming due to greenhouse gases, especially in pre-monsoon maximum temperature. This is also known as the ‘aerosol effect’. Despite the overall cooler temperatures in the Bay of Bengal as compared to elsewhere in the Indian Ocean, there was a somewhat warmer patch of water just off the coast of Chennai on December 1.
Vulnerability & exposure
Chennai is a coastal mega-city which has encountered explosive and largely unplanned growth over the past 15 years. The city of 8.2 million has an estimated 150,000 illegal buildings. Land-use issues like decreased natural areas, loss of water bodies, encroachment of river and streams and other drainage channels, and uncontrolled multiplication of built-up areas have been identified as factors that contribute to high vulnerability and exposure to floods in Chennai. On December 1, the extreme rainfall brought nearly-full reservoirs to capacity, prompting local authorities to release water into the rivers which subsequently overflowed and flooded low-lying areas. In a report, the Parliamentary Standing Committee on Home Affairs acknowledged the lack of timely desilting, inadequate flood zone planning and large scale settlements in low-lying areas as major contributors to the impacts that occurred in the city.
Analysis
To assess the potential link between the heavy rainfall in Chennai on December 1, 2015 and human-caused greenhouse gases in the atmosphere, Climate Central, the Royal Netherlands Meteorological Institute (KNMI), the University of Oxford, and the Indian Institute of Technology, Delhi (IITD) – as part of the World Weather Attribution (WWA) partnership which also includes Red Cross Red Crescent Climate Centre and University of Melbourne – conducted independent assessments using multiple peer-reviewed approaches of extreme event attribution methodologies. These approaches involve statistical analyses of the historical precipitation record, the trend in global climate models, and the results of thousands of simulations of possible weather with a regional climate model. Applying multiple methods provides scientists with a means to assess confidence in the results.
For the observational analysis, scientists analyzed two datasets of daily precipitation in the region. The public GHCN-D dataset has 50 stations with at least 40 years of data in the coastal area 10°–15°N, 79.5°–81°E for a total of 3504 station-years. However, all but two of the series end in 1970. The India Meteorological Department (IMD) provided 19 non-public series from the region for 1969–2013.
For the global model analysis, the team analyzed the rainfall extremes in a relatively high-resolution (150-km) ensemble of model runs, 16 historical/RCP8.5 experiments using the EC-Earth 2.3 model at T159. The CMIP5 multi-model ensemble contains many models with a hard upper boundary of rainfall in the grid box corresponding to Chennai, in contrast to the observed probability distribution function, so researchers were unable to use the models. For a more regional look, the scientists analyzed the rainfall extremes in the regional atmosphere-only general circulation model HadRM3P, used in the weather@home distributed computing framework.
Results
The highest observed daily rainfall, 494 mm, was an extreme occurrence meteorologically, with a probability of occurrence in the current climate of one in 600 to 2500 per year (95% level of confidence). This would have overwhelmed flood prevention measures in any city.
No effect of human-induced climate change was detected in the the extreme one-day rainfall that caused widespread flooding in Chennai, India on December 1, 2015, neither from 1900–1970, nor from 1970–2014. Coupled models show more extreme one-day precipitation events from 1970–2015, but a large ensemble of observed SST-forced models again shows no increase in the probability of extreme one-day precipitation due to human-caused emissions. A plausible factor is the lack of increase in SSTs in the western Bay of Bengal over the last 40 years, which is not reproduced correctly by the coupled models but is realistic in the SST-forced model. We therefore discard the results from the coupled global model as unrealistic. The other results, from observations and the SST-forced regional model, preclude an attribution of the heavy rains to human-caused factors, probably due to the two main pollutants, greenhouse gases and aerosols, having opposing effects.
There is a small but clear increase in probability of extremes in the SST-forced regional model, associated with El Niño and other non-anthropogenic SST anomalies. In the observations, the ENSO signal is also present but not statistically significant.
Aerosols
In climate science, the word ‘aerosol’ is generally used to mean “atmospheric particulate”, particles like dust and sea salt that occur naturally and others that come from the burning of types of fossil fuels and biomass. This is not to be confused with ozone-damaging chlorofluorocarbons (CFCs) released from spray cans. Like greenhouse gases, aerosols affect the Earth’s radiative balance, intercepting solar radiation and either reflecting it back or absorbing it high in the atmosphere. Overall, aerosols have had a cooling effect on the surface, countering global warming. However, aerosols come with a host of negative impacts, specifically on climate and weather patterns, and on human health. The World Health Organization estimates that these pollutants are one of the leading causes of worldwide mortality, contributing to as many as seven million premature deaths each year.
Scientific parameters
Variable:
Chennai, India: Precipitation
Event Definition:
1-day maximum average precipitation, 08:3o LT 1 Dec 2015 to 08:30 LT 2 Dec 2015
Domain:
Southeastern India, 10°–15°N, 79.5°–81°E
Observational data:
GHCN-D dataset, 10°–15°N, 79.5°–81°E; 19 nonpublic series provided by India Meteorological Department (IMD)
Models used:
EC-Earth 2.3 model, at T159, about 150-km resolution (considered but not used because it showed a wrong trend in SSTs); CMIP5 (considered but not used); HadRM3P
Results
No effect of human-caused emissions was detected in the the extreme one-day rainfall that caused widespread flooding in Chennai, India on December 1, 2015.
The manuscript was published in the special supplement to the Bulletin of the American Meteorological Society Vol. 97, No. 12, December 2016.


