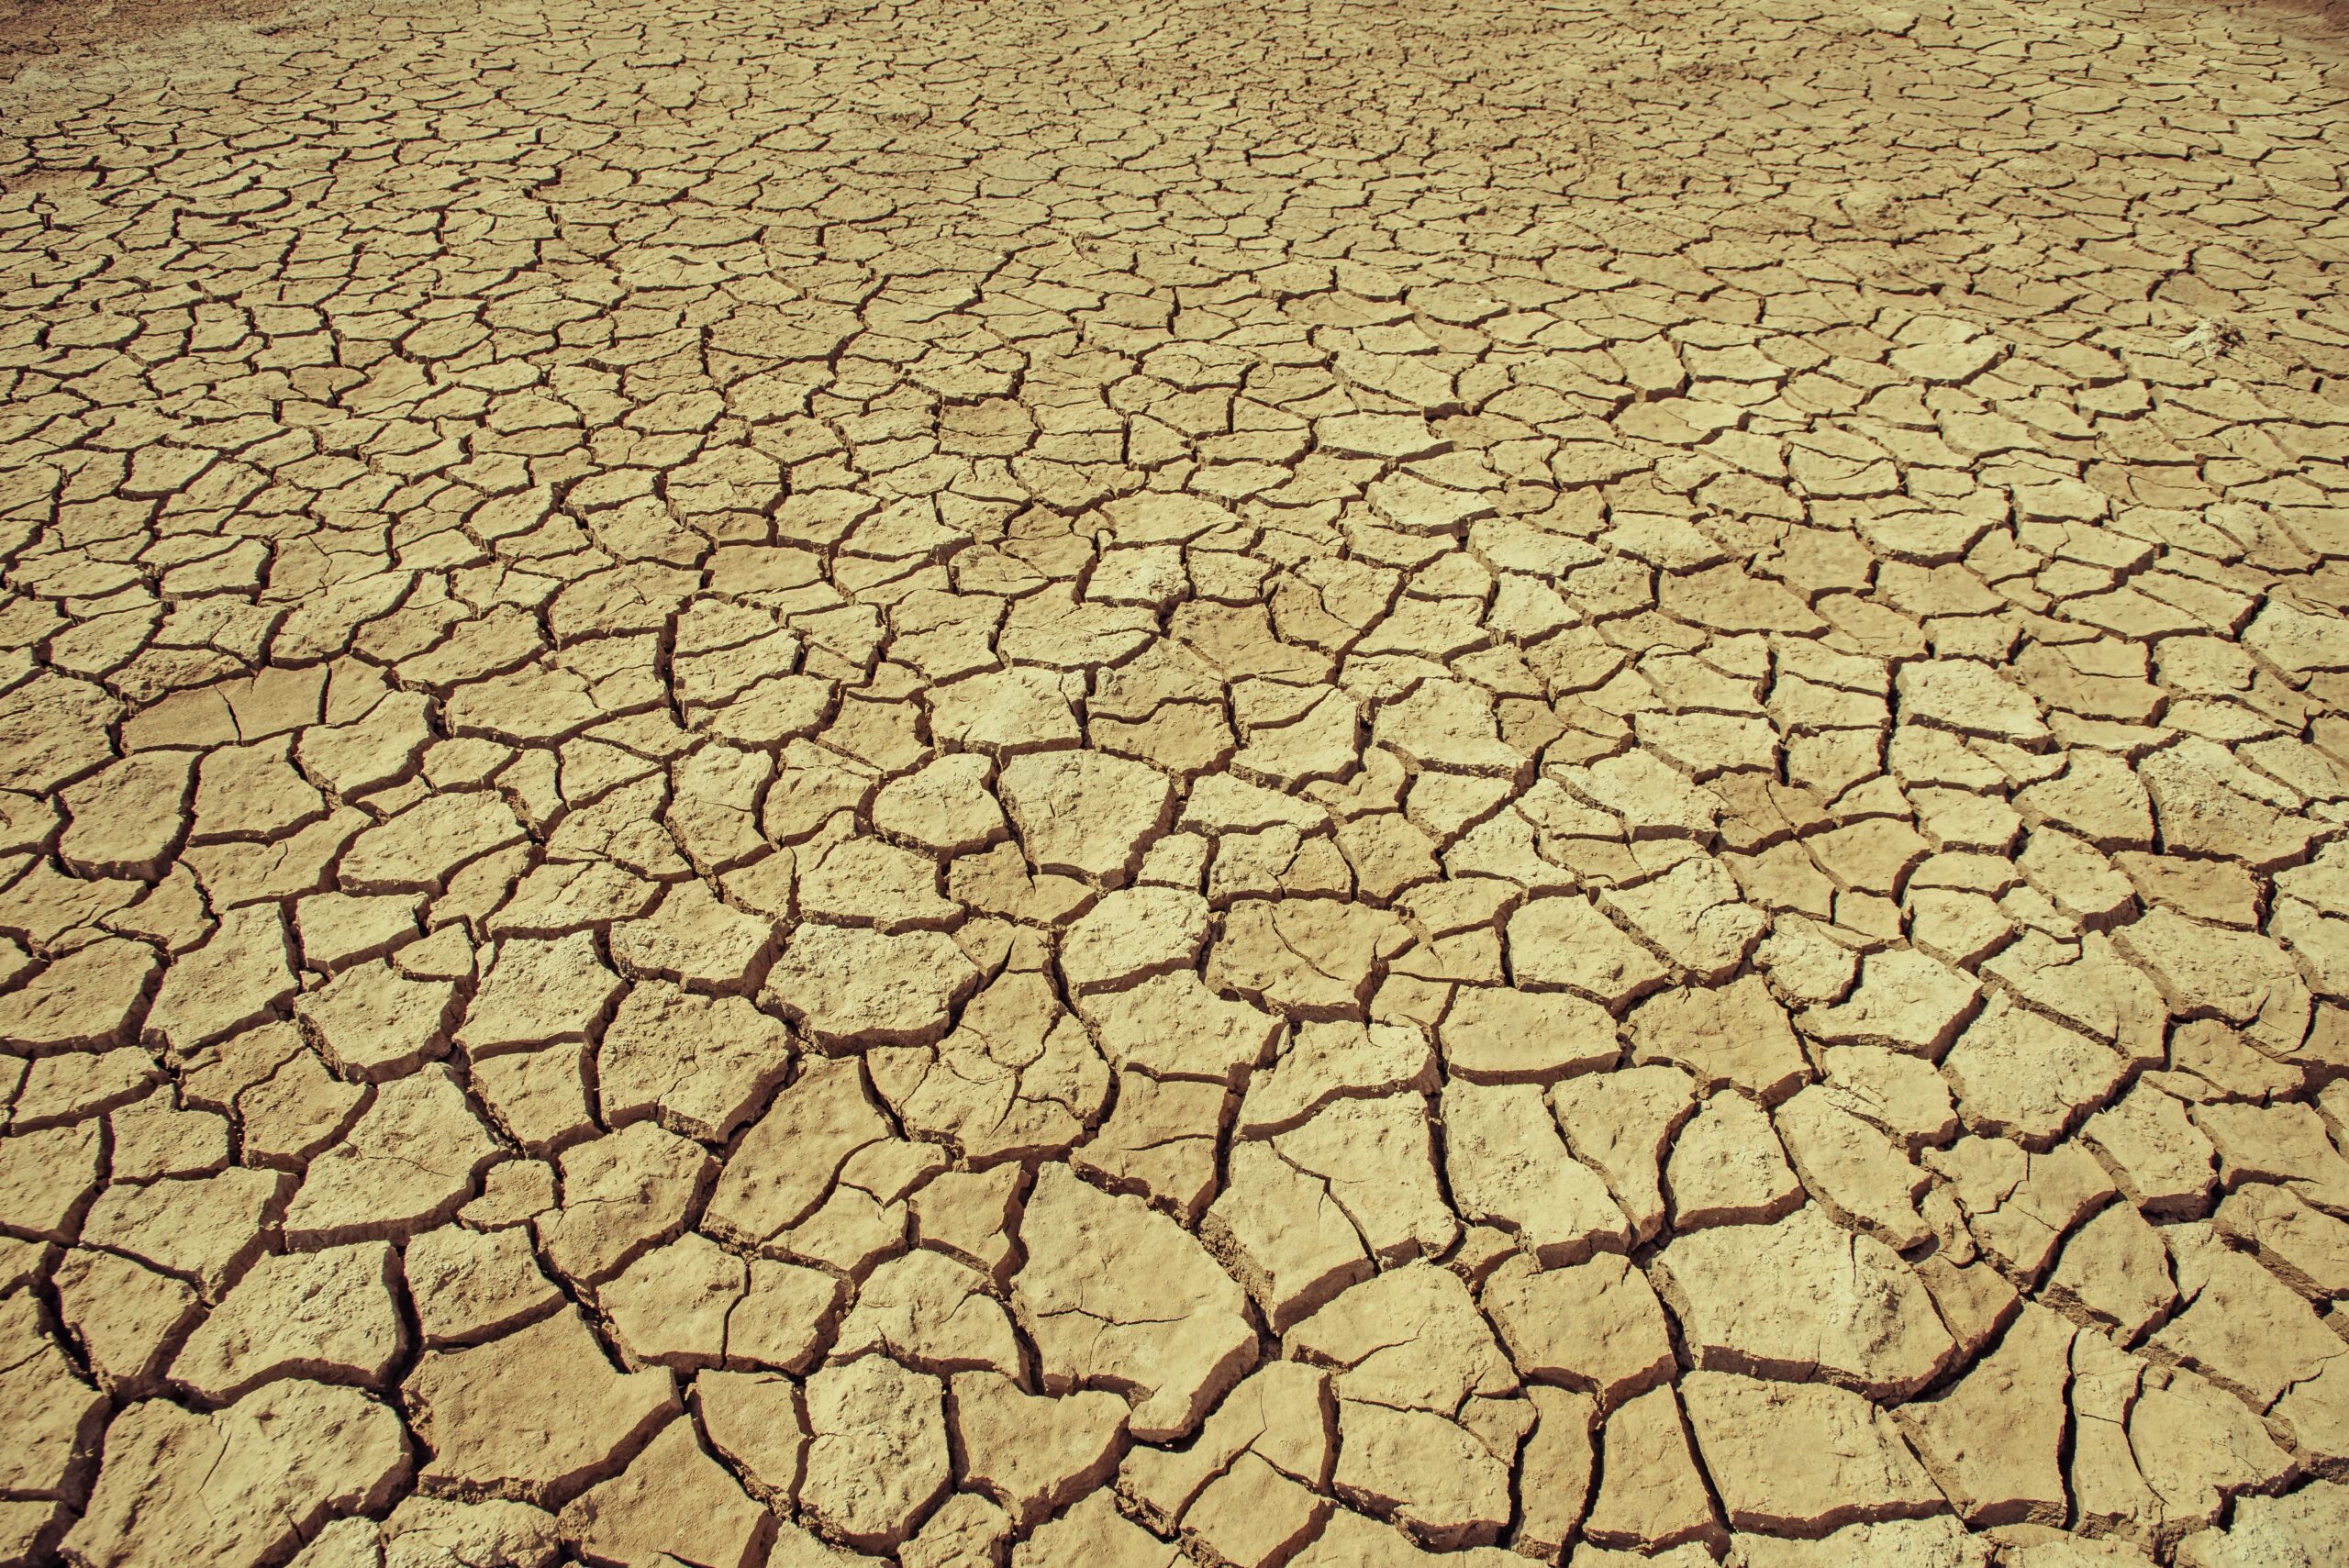
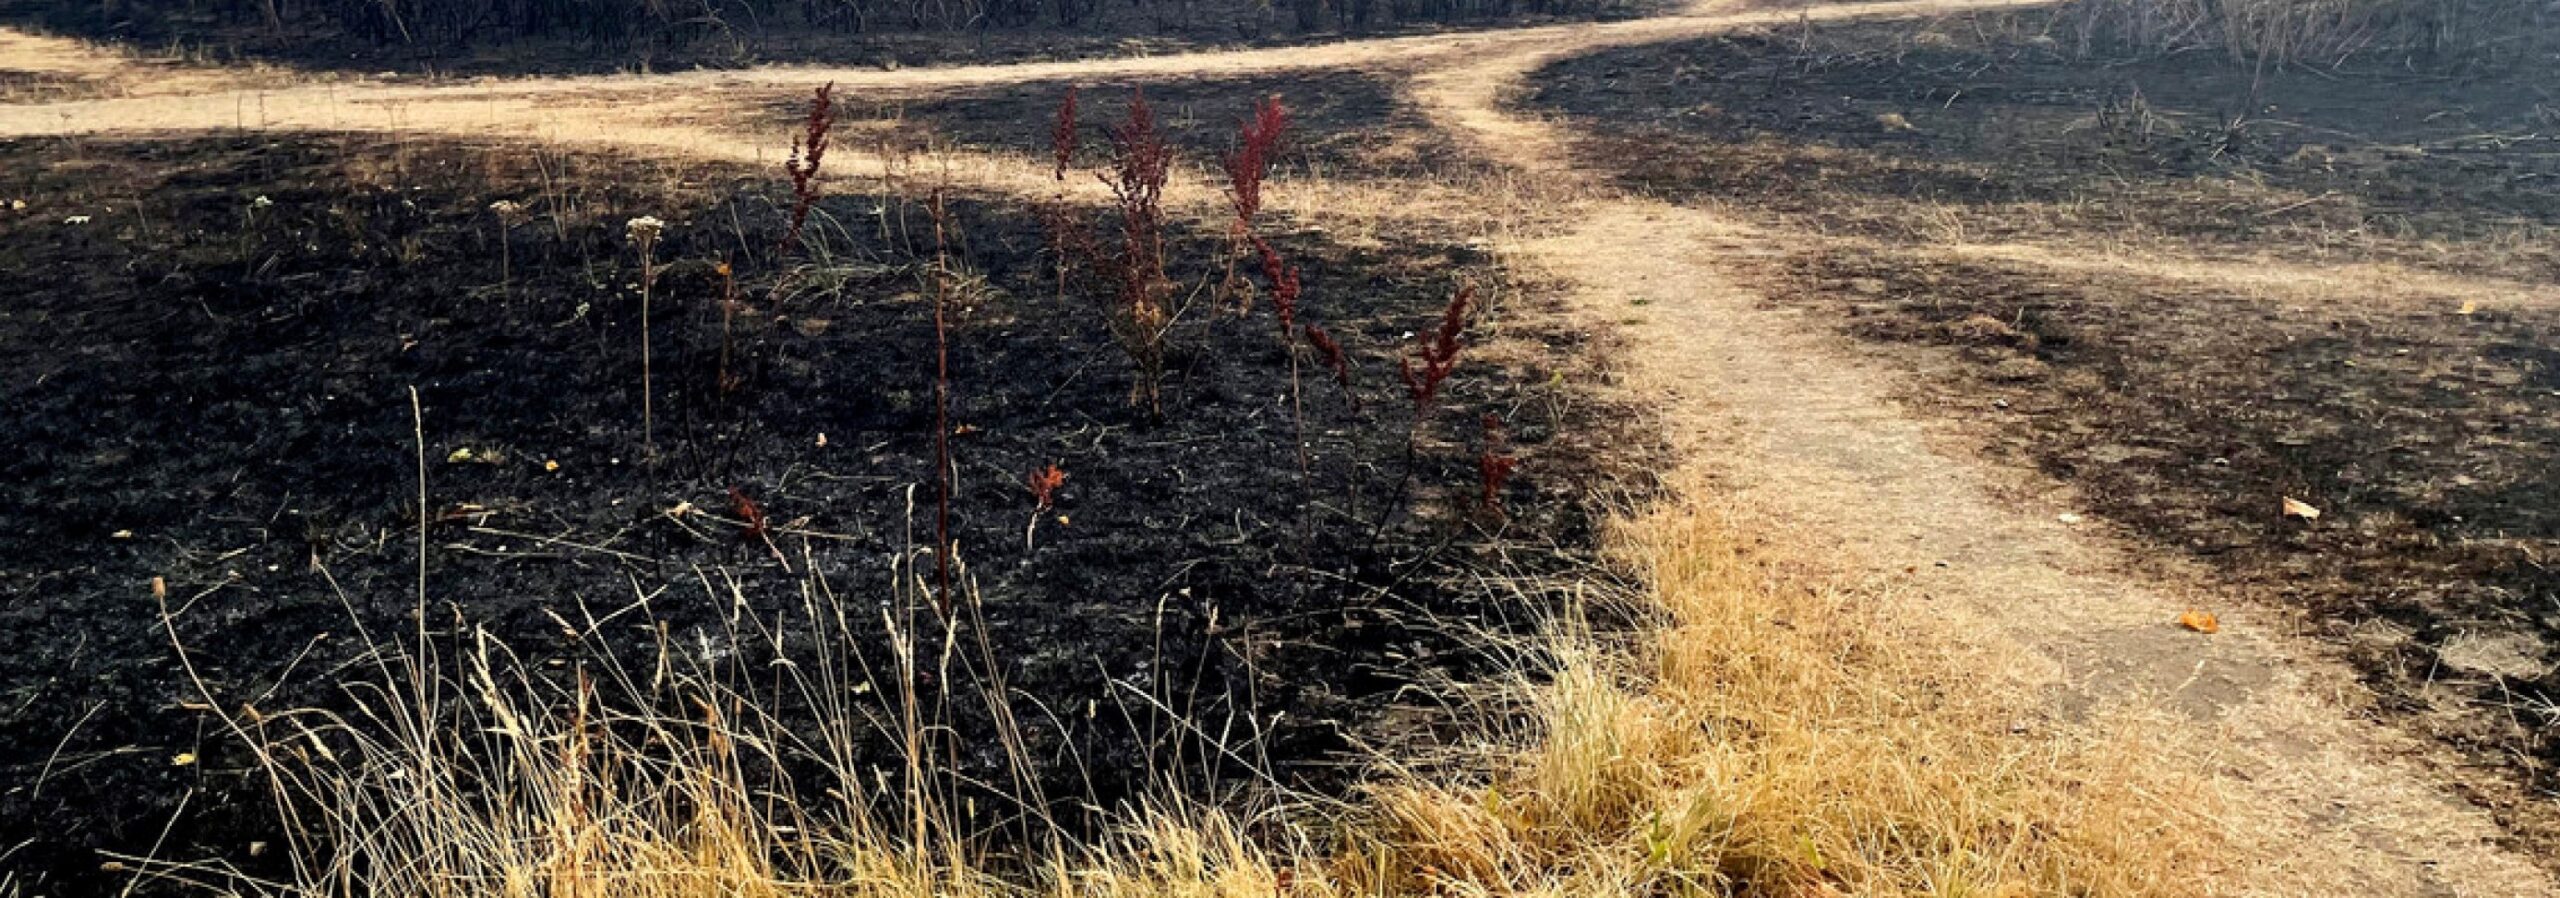
The dry conditions left hundreds of thousands of farmers with failed crops and weakened or dead livestock. The magnitude of the devastation to Ethiopia led the UN’s Allahoury Diallo to declare that the “drought is not just a food crisis – it is, above all, a livelihood crisis.”
Key findings
- The areas of north and central Ethiopia suffered their worst drought in decades in 2015, a year marked by a strong El Niño.
- The drought affected nearly 10 million Ethiopians.
- Scientists with World Weather Attribution used multiple methods of attribution science to look at the possible roles climate change and El Niño played in the drought.
- They found that El Niño made this rare drought even drier in the Kiremt season.
- No influence of climate change could be found, with the spread of possible trends ranging from drought being 40 percent less to four times more probable.
Event
Signs of trouble began to surface early in the year. Farmers waited for the Belg rains that generally occur between February and May in the central and eastern parts of the country (Figure 1). About 10 percent of the Ethiopian population depends completely on this season to provide rainfall for crops and pastures. But in 2015, after a false start the Belg rains came a month late in northern and central Ethiopia.
What also arrived was a particularly strong El Niño, associated with the warming of equatorial waters in the Pacific Ocean. The effects of El Niño play out in different ways across the planet. In Ethiopia, El Niño can lead to drier conditions, mainly in the northwestern part of the country, affecting the rainy season known as Kiremt that occurs from June through September. In a normal year, the Kiremt rains account for 50 – 80 percent of annual rainfall. But in 2015, the Kiremt season was delayed and the rains were erratic and below average. From February through August 2015 the northern central and some eastern parts of the country received only 500 mm of rainfall, a deficit of 167 mm from the long-term average (CHIRPS). Only one-half to three-quarters of the rainfall expected was received from February through September (Singh et al. 2016).
In a world warmed by human-induced climate change, droughts are expected to become more common and more severe in some parts of the world. Is this region one of these?
Analysis
Given the extreme nature of the 2015 drought in Ethiopia, we conducted an analysis to see if climate change played a role in this drought. The influence of El Niño was also analysed.
Researchers looked at the dry central to northern region of the country (Figure 1), basing the boundaries on the homogeneity of climatological rainfall and topography. They studied the more reliable data from 1960 – 2015, focusing on the months of February through September during which almost all rain falls.
To assess the extent to which the Ethiopian drought of 2015 was linked to human-induced climate conditions, the WWA team conducted independent assessments with three peer-reviewed approaches that use: (1) statistical analyses of historical observational datasets (2) data from global climate models, and (3) a large ensemble of simulations of possible weather scenarios with a global climate model. Analyzing the event using numerous methods provides a means to assess confidence in the results.
The set of global climate models contributing to this analysis are EC-Earth, weather@home and CMIP5. The coupled general circulation model EC-Earth’s analysis was run on 16 experiments 1861-2100 using CMIP5 protocol. Weather@home, an atmosphere-only general circulation model, provided weather simulations under observed climate conditions (sea-surface temperatures and sea-ice conditions) as well as simulations without human-induced climate change. CMIP5 is the multi-model ensemble prepared for the IPCC Fifth assessment report.
Two key outputs from these analyses are determining the return period of the February-September precipitation amount, and examining how the likelihood of the event has changed due to global warming. For the observational data and EC-Earth model, this is explored by fitting the precipitation data to a Gaussian distribution and allowing the Gaussian fit parameters to be a function of the low-pass filtered (smoothed) global mean surface temperature (GMST), scaling the probability distribution function (PDF) up or down with GMST to represent the climate of 1960 and 2015. For the weather@home and CMIP5 models, the return times are directly estimated in the current climate and in a counter-factual climate without human influence. The ratio of the resulting frequency of occurrence of such a drought event today compared to the past, before there was a strong human influence on the climate system, measures the extent to which climate change affected the likelihood of the event.


Results
The observed 2015 drought was an extremely rare event that is expected to happen in the central to northeastern parts of Ethiopia only around once every few hundred years (best estimate 260 years, lowest estimate of 60 years, according to the 95% confidence interval, based on the gridded CenTrends data set extended with CHIRPS, mainly satellite data in 2015) in the current climate. The longest return periods are in the southwestern region of the study area. The return period at the station Addis Ababa however was found to be only three years (two to five years, according to the 95% confidence interval). This disparity with the gridded CenTrends dataset is due to a few possible reasons, including scarcity of station data, differing characteristics of point data versus area averaged data and small scale variability within the study area. Using the regression between El Niño (NINO3.4 index) and the precipitation series to subtract the influence of El Niño from the observational data suggests that the 2015 drought was exceptional and enhanced by El Niño. Without El Niño, the event would likely have been wetter, with results indicating a return period of 80 years (lowest estimate of 20 years, according to the 95% confidence interval) instead of the actual 260 years (lowest estimate of 60 years, according to the 95% confidence interval).
The story is more complex when it comes to the role of human-induced climate change in the 2015 extreme drought. Overall, the climate models used indicate a wide spread of results regarding the possible influence of climate change.
- The EC-Earth model analysis indicates a non-significant drying trend, with a risk ratio between now and 1960 of 1.4 (0.9-1.9 according to the 95% confidence interval).
- The weather@home simulations paint different pictures for the Belg and Kiremt rainy seasons.
- The Belg season shows no significant change in likelihood of such drought events due to human-caused climate change nor SSTs.
During the Kiremt season, and concomitantly also for the joint season, simulations indicate that human-induced climate change did increase the frequency of such an event. For example, a once in 100 year joint-season event in the world today is simulated as a once in over 230 year event in a world without human-induced climate change. Analysis of the CMIP5 ensemble indicated a return period of the drought of about 30 years, with no difference in frequency from pre-industrial times. Overall, the trends in droughts in the models between the current and pre-industrial climate range from being a factor of 1.7 less likely to a drying trend of four times more likely. Whilst these model results are statistically compatible with gridded observations (due to the large spread of possible trends from gridded observations ranging from a factor five decrease to a factor 10 increase in likelihood), they are not compatible with each other, which implies that the differences are not only due to natural variability but also due to model spread, which has been taken into account in the final uncertainty range. As this range encompasses no change, the drought cannot be attributed to climate change.
Exposure & vulnerability
In December 2016 the Government of Ethiopia and the United Nations (UN) jointly released a Humanitarian Response Document (HRD) calling for emergency assistance for 10.2 million people, in addition to the 7.9 million people under routine support from the national social safety net program, Productive Safety Net Programme (PSNP) (AKLDP, 2016). Beyond total precipitation deficits, both the timing and the spatial distribution of rainfall impacted livelihood activities, such as agriculture and pastoralism (Singh et al., 2016). In 2016, many parts of the central and northern Ethiopia were reported to be in IPC Phase 3 of food insecurity – the ‘acute crisis’ phase (FEWS, 2017). In the most affected areas, over 75 percent of crop production was reported lost, one million livestock were reported to have died, 1.7 million people are estimated to experience Moderate to Acute Malnutrition (MAM) and 435,000 people are estimated to experience severe acute malnutrition (SAM) (HRD, 2016). The Government of Ethiopia and the international humanitarian community mobilized to meet emergency needs, including provisions of water, sanitation and hygiene, food and nutrition.
Ethiopia is one of the fastest-growing economies in Africa, with an average economic growth rate of 10.8 percent per annum between 2003 and 2015 (World Bank 2016). In parallel, over a similar period, the number of Ethiopians living in extreme poverty dropped by 22 percentage points, reducing from 55.3 percent in 2000 to 33.5 percent in 2011. The Ethiopian government is currently implementing the second phase of its Growth and Transformation Plan in an effort to further advance these strong trends (World Bank 2016). In addition, in collaboration with longstanding development partners, the Ethiopian government has also implemented the PSNP since 2005. The PSNP uses food and cash transfers to help households overcome food deficits in order to improve overall food security. As of 2017, the program has entered its fourth phase and serves 7.997 million food insecure people each year (PSNP n.d.). During the 2015/2016 drought the PSNP program continued to provide cash transfers to clients and extended cash transfers into the Somali region. While food transfers were delayed, cash transfers was increased to fill the gap. In addition the PSNP suspended infrastructure requirements in some areas due to the drought conditions.
Despite its impacts, with the current drought estimated to be most likely a one in several hundred year event, a rarity that would place significant strains on most public services, the lower impact of this drought compared to those in 1984 and 1973 is a testament to the advances being made in improving the resilience of Ethiopians to climate shock and stresses.
Scientific parameters
| Variable | Precipitation |
|---|---|
| Event definition | Feb-Sept 2015, which combines the Belg (Feb-May) and Kiremt (June-Sept) rainy seasons |
| Domain | Central to northeastern Ethiopia, 8°-13°N, 38°–43°E |
| Observational data | Two gridded precipitation datasets: CenTrends, 1960-2014, CHIRPS, 2015; Station data (Addis Ababa, Alem Ketema, Combolcha) |
| Models used | EC-Earth 2.3 model, at T159, about 125-km resolution; weather@home (50km resolution); CMIP5 multi-model ensemble; HadGEM3A (considered but not used) |
Results
El Niño enhanced the drought, making a rare event (1 in 80 years) even more rare (1 in several hundred years), according to correlations in the observations. The models and observations do not show conclusive results on the influence of climate change.
References
AKLDP. (2016) El Niño in Ethiopia, 2015-2016 – a real-time review of impacts and responses. USAID/Ethiopia Agriculture Knowledge, Learning, Documentation and Policy Project Contract number: 663‐13‐000006, 1-28.
FEWS NET, Crisis (IPC Phase 3) expected in parts of Oromia, SNNPR, and southern pastoral areas. FEWS NET Reports, 2017, 1-13.
Government of Ethiopia, Ethiopia Humanitarian Country Team, (2016) Ethiopia Humanitarian Requirements Document. Joint Government and Humanitarian Partners’ Document.
Singh, R., Worku, M., Bogale, S., Cullis, A., Adem, A., Irwin, B., Lim, S., Bosi, L. and Venton, C.C. (2016) Reality of resilience: perspectives of the 2015-16 drought in Ethiopia. BRACED Resilience Intel: 2016, Issue 6.


