The below-average rainfall in the October-December (OND) 2022 season “short rains” was the fifth consecutive failed season since OND 2020, including the below-average March-May (MAM) “long rains” in 2021 and 2022. The resulting drought was reported to be the worst in 40 years (WMO, 2022, FAO 2022).
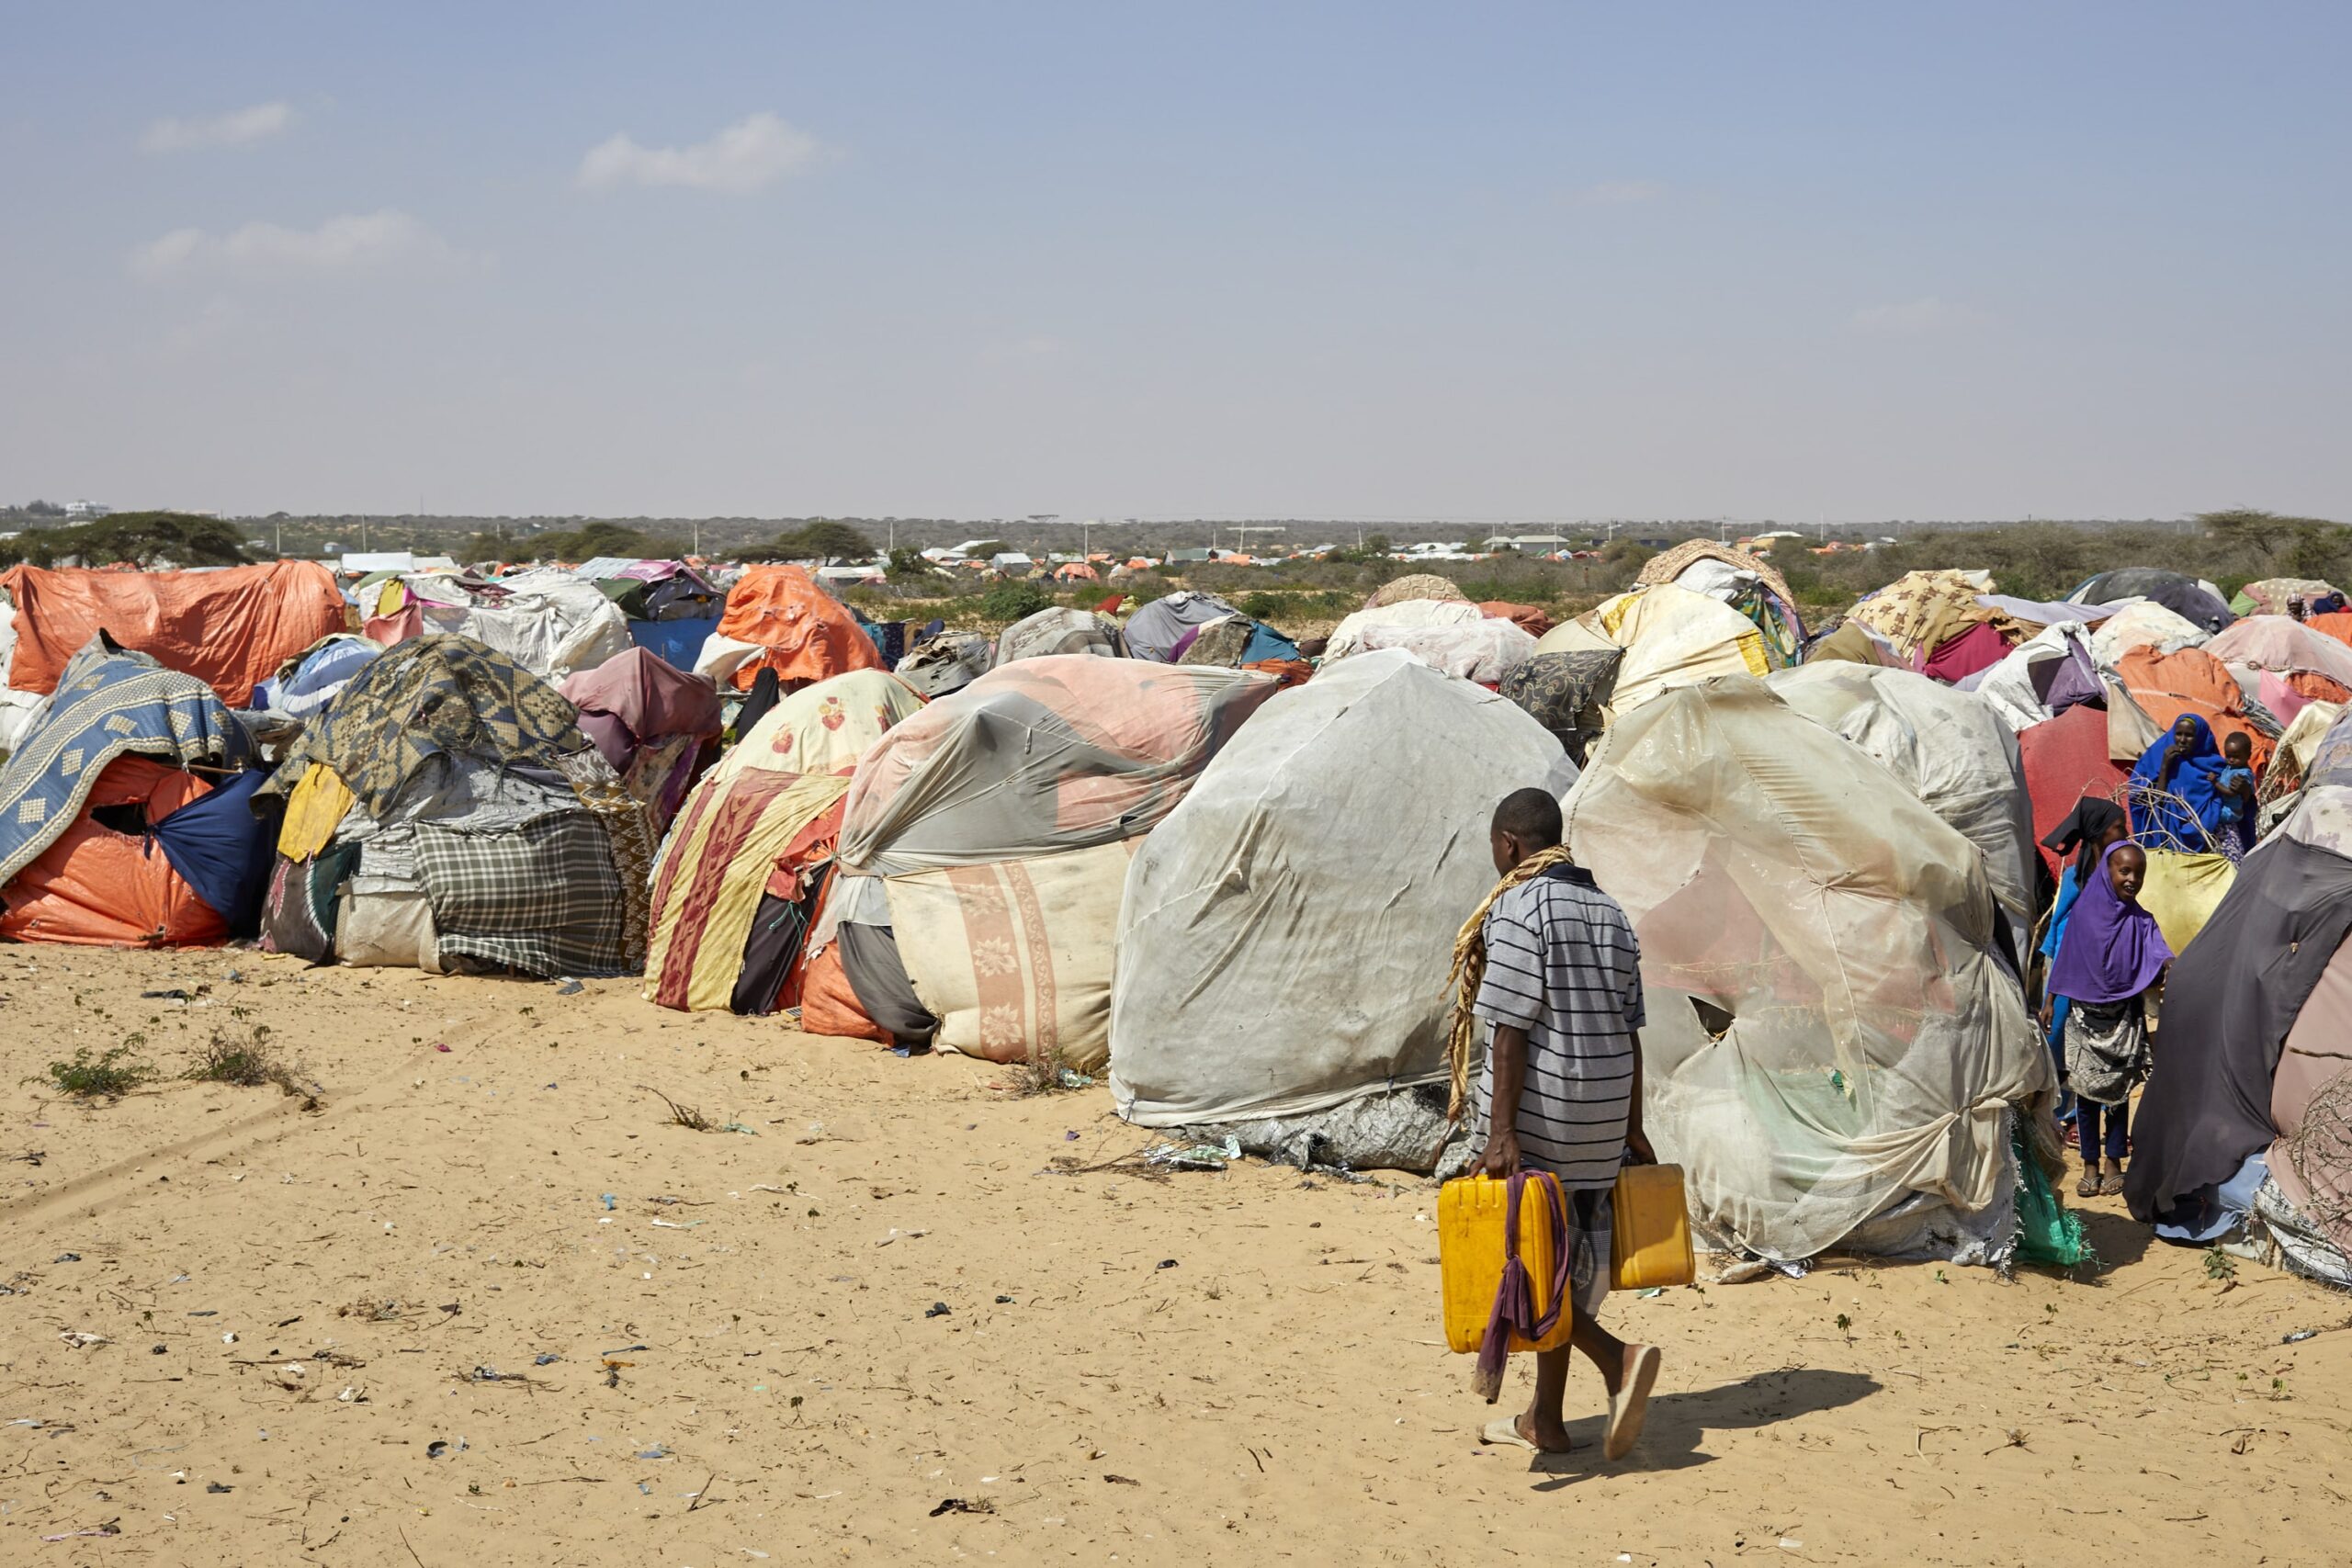
The drought has led to substantial harvest failure, poor pasture conditions, livestock losses, decreased surface water availability and human conflicts, leaving 4.35 million people in need of humanitarian assistance (NDMA, 2022). At least 180,000 refugees from Somalia and South Sudan crossed into the drought-stricken areas of Kenya and Ethiopia (UNHCR).
By January 2023, close to 9,210 MT of food commodities had been distributed and USD 7.29 million cash-based transfers had been made (OCHA, 2023). Despite some reported rains in parts of Kenya by the end of March 2023 (KMD, 2023), the drought conditions are not likely to recover quickly enough to see improvements in food security before mid-2023.
Scientists from Kenya, Mozambique, South Africa, the United States of America, the Netherlands, Germany and the United Kingdom collaborated to assess to what extent human-induced climate change altered the likelihood and intensity of the low rainfall that led to drought, as well as the increase in evaporation due to climate change, exacerbating drought severity.
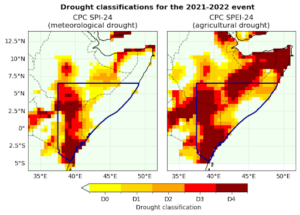
Figure 1: Left: Drought classifications based on Standardised Precipitation Index (SPI; US Drought Monitor, 2023), reflecting the magnitudes of precipitation deficit from Jan 2021-Dec 2022 relative to the 1980-2010 climatology in the CPC dataset. Right: Drought classifications based on Standardised Precipitation Evapotranspiration Index (SPEI), reflecting the magnitudes of precipitation deficit from Jan 2021-Dec 2022 relative to the 1980-2010 climatology in the CPC dataset. The bold black outline highlights the study region.
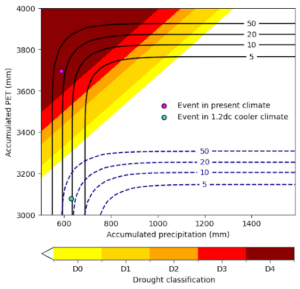
Figure 2: Joint distribution of 24-month precip and PET with corresponding SPEI drought classification. The solid contours indicate return periods under the joint distribution in the current climate, while the dashed contours indicate the same return periods in a 1.2°C cooler climate. The shaded contours represent different levels of drought severity. The magenta point indicates the 2022 drought event in the current climate, with a joint return period of 26 years (uncertainty: 23-37 years), while the turquoise point shows an event of the equivalent severity in a 1.2°C cooler climate.
Main findings
- The Southern part of the Horn of Africa, covering parts of southern Ethiopia, southern Somalia, and eastern Kenya (see figure 1), saw below average rainfall for the short rains (October-December) in 2020, 2021 and 2022 as well as the long rains (March-May) in 2021 and 2022.
- As one of the world’s most impoverished regions, the Horn of Africa is home to millions of people facing chronic food and water insecurity, malnutrition, and limited access to basic services including infrastructure, health care, education, and social welfare. The ongoing drought has turned these underlying conditions into acute food insecurity for over 4 million inhabitants.
- In order to identify whether human-induced climate change was a driver of the low rainfall, i.e the meteorological drought, we analysed rainfall over the most impacted region in the Southern Horn of Africa, covering parts of southern Ethiopia, southern Somalia, and eastern Kenya, for 24 consecutive months, from January 2021 to December 2022, as well as just the individual 2022 March-May and October-December seasons separately.
- We find that in today’s climate, which has been warmed about 1.2°C by human-induced greenhouse gas emissions, the below-average rainfall in the March-May season is a 1 in 10 year event, a 1 in 5 year event in the short rains. For the entire 24-month period there is a 5% chance in every year for such an event to develop.
- Using two observation-based rainfall products we find there is a trend towards less rainfall in the long rains but not over the short rains, which show the opposite, a wettening. There is no trend when looking at the short and long rains combined over 24 months.
- The years of the drought also saw consecutive La Niña conditions. There is a high correlation between below-average short rains and La Niña, but there is no correlation with the long rains. When taking into account the effect of La Niña there is a trend towards wetter conditions in the short rains.
- To formally attribute these trends to climate change and to try to quantify its contribution to the drought, we used climate models and looked at similarly low rainfall events over the same region in the model data. We found that the models show similar results to the observations: low rainfall events like those currently observed in the long rains have become about twice as likely due to human-induced climate change, while there is no attributable change when short and long rains are combined. In the short rains, models where the effect of La Niña is taken into account show that a low rainfall season like the one observed has become less likely, making the increased rainfall in the short rains attributable to human-induced climate change.
- In order to understand whether climate change influenced not only the meteorological drought (i.e. low rainfall), but also other aspects of the drought, including the agricultural drought which influences how much water is available for plants, we also looked at the role of temperature. To do this we combined the rainfall assessment with an assessment of changes in potential evapotranspiration, i.e. how much water evaporates from soil and plants because of higher temperatures, in a multivariate analysis for the 24 months of drought.
- We found that, as a result of human-induced climate change, the combination of low rainfall and high evapotranspiration as unusual as the recent conditions would not have led to drought at all in a 1.2°C cooler world (see figure 2). In today’s climate the same event is now classified as an exceptional drought (D4, dark red in fig. 1), with major crop and pasture losses and widespread water shortages. This change in drought severity is primarily due to the strong increase in evaporative demand caused by higher temperatures.
- Climate change has made events like the current drought much stronger and more likely; a conservative estimate is that such droughts have become about 100 times more likely.
- Fundamental to food security, health, and income, households engaged in rain-fed agriculture, agropastoralism, and pastoralism are vulnerable to drought and are among the most severely impacted groups when crop and livestock health decline. When rains fail these households are are forced to spend their limited assets on buffering losses and damages, and are consequently pushed further into poverty. State fragility and conflict, as well as the length of the drought played a significant role in worsening outcomes, especially for people in Somalia. Further, the severity of impacts linked to the long duration of the drought also raises serious questions about the length of droughts that government drought management systems and the international aid infrastructure should be prepared to handle in the future.
- The results of the study, coupled with climate projections indicating high confidence of increased heavy precipitation and pluvial floods in the north eastern Africa region (IPCC AR6), is illustrative of the myriad of climate impacts that people and governments in this region are confronted with. Taken together, regional climate variability and the projections indicate the need to invest in adaptation strategies that are robust to both wet and dry extremes, and which can be iterated upon as climate signals emerge and future projections become more certain.


