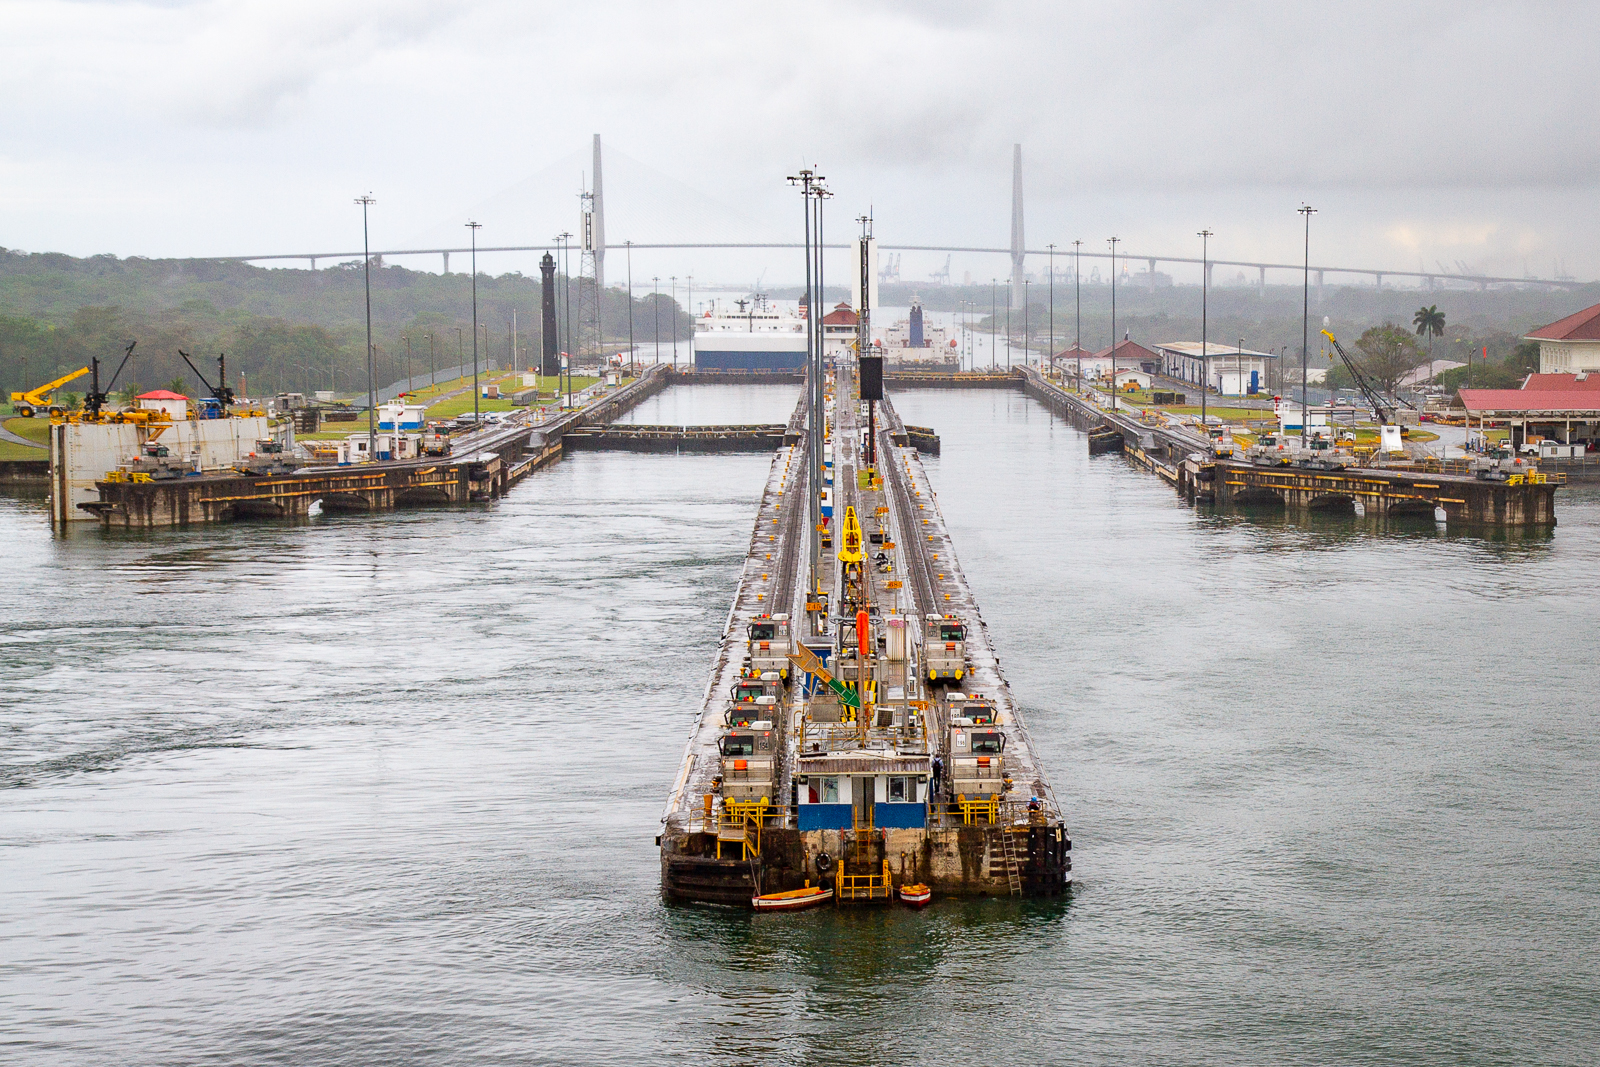
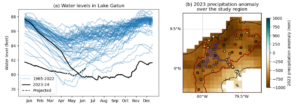
Since June 2023, the Panama Canal Authority has been restricting both the number and size of ships passing through the Panama Canal due to historically low water levels in Lake Gatun, the principal hydrological reserve for the Canal (Figure 1a), causing disruptions to global shipping that are still ongoing.
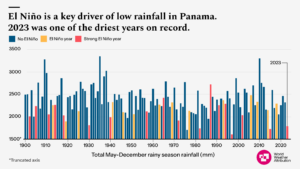
Rainfall in Panama is known to be strongly influenced by the El Niño Southern Oscillation (ENSO), with large storms and extremely heavy precipitation tending to occur in the negative phase (La Niña years) and the positive phase (El Niño years such as 2023-24) typically associated with late onset and early end of the rainy season, and lower precipitation throughout.
Scientists from Panama, the Netherlands, Sweden, and the United Kingdom collaborated to assess to what extent the 2023-4 El Niño and human-induced climate change altered the likelihood and intensity of the low rainfall during 2023, and also examined whether changes in evapotranspiration may have contributed to the low lake levels.
The study uses peer-reviewed methods to assess changes in May-December rainfall in the area immediately around the catchment of Lake Gatun in central Panama (Figure 1b). Potential evapotranspiration is evaluated over the same region during the dry season (January-April).
Main findings
- The rainfall deficits not only affect global shipping, but also the people who live and work in the Panama Canal Watershed. Indigenous, Afro-Panamanian, and some rural communities have water-dependent livelihoods and limited access to basic services such as electricity, water and sanitation. Therefore, even small changes in rainfall can have disproportionate impacts on their livelihoods, highlighting the interplay between climate and economic deprivation.
- Urban expansion and population growth, combined with aging infrastructure that loses significant amounts of water through leaks, are increasing pressure on water supplies, especially during dry periods.
- Restrictions on shipping through the Panama Canal have wide-ranging global impacts. Many ships now have to take longer shipping routes, which worsens delays at other ports and drives demand for trucking and rail services, increasing costs and greenhouse gas emissions.
- Reduced revenue for the Panama Canal Authority could threaten employment in canal-related industries, and can worsen existing socio-economic challenges for local communities and in developing countries vulnerable to inflation increases.
- Low rainfall during the 2023 rainy season (May-December) has contributed to extremely low water levels in Lake Gatun in Panama despite above-average water levels in the lake at the beginning of the year.
- Historically, the lowest lake levels have occurred the year after low-precipitation rainy seasons: lake levels remained at a seasonal low during the first three months of 2024 but are expected to begin to recover with the onset of the rainy season in May.
- During El Niño conditions in the current climate, with 1.2C of warming, an event of this magnitude is expected to happen more often than under neutral ENSO conditions. In the present climate, there is a 5% chance of such an event occurring in an El Niño year. Given the observed frequency of El Niño years, this means that similar events would be expected to occur around once every 40 years in the current climate that has been warmed by 1.2C due to the burning of fossil fuels. We expect around 8% less precipitation in an El Niño year than under neutral ENSO conditions.
- There is some evidence of drying in the observational record, especially in stations bordering the lake, but other stations in the study area show a wettening. The gridded observational data-products, which are much shorter than the station data, do not consistently exhibit a drying trend.
- To identify whether this trend is due to human-induced climate change we then also look at climate models with high enough resolution to capture precipitation over the study region. Only one of the available climate models show a similar drying, while all others either show no trend or a wettening.
- With neither climate model data nor a strong physical argument to support the hypothesis, we therefore cannot conclude that the observed drying is attributable to human-caused climate change.
- Evapotranspiration in Panama is mainly driven by wind speed, humidity and cloud cover which is in contrast to most other regions in the world, where temperature is a key driver. Although there is evidence in some of the observational products that evapotranspiration in the region will increase in a warming climate, the amount of water lost annually through evapotranspiration in this area is small compared to the rainfall deficits from lack of rainfall.
- Future trends in this region under continued warming are also uncertain. However, future El Niño years will continue to bring low rainfall and, without adaptation action, similarly low lake levels.